Results and Graphs of Intermittent and Continuous Loading
When doing the simulations of the filtering process, it is important to realize how many orthogonal collocation points to take in order for the graph to look like the provided model graph. The results obtained were comprable to the results of Dr. Moe. If the results match the data provided by Dr. Moe, then it can be assured that the program is working correctly. It can be seen that with three orthogonal collocation points, the graph clearly shares some characteristics as the model, but it does not align with it as expected, so more orthogonal collocation points are taken. With five orthogonal collocation points, it can be seen that the graph is very close to the model, yet there is still a slight deviation. So now seven orthogonal collocation points are taken, and the graph produced from the results lines up almost exactly with the model. There are no deviations from the model to show that the simulations are giving improper data. Therefore, it is sufficient to say taking seven orthogonal collocation points can give an accurate reading of results of the current specifications of the filtering process. As expected, eight orthogonal collocation points gives the same graph. Professor Moe’s experimental results have compared almost identically. Thus from this, the program seems to be working efficiently.

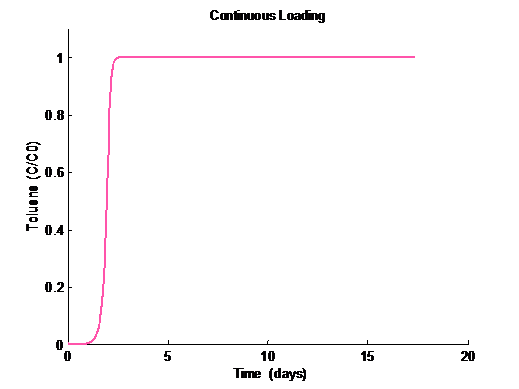
It has been seen that the program works with constant loading. With the simulation of continuous loading, the toluene is injected into the air at a steady rate until the filter is saturated. The rate of saturation depends on the concentration of the pollutant (i.e. toluene) in the air.
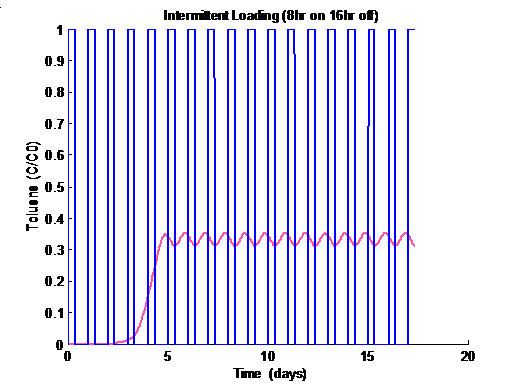
The program was also used in a simulation with intermittent loading. This means that instead of a constant flow of pollutant through the filter, the contaminated air was released through the filter for a time period of 8 hours on, then 16 hours off. This was done continuously for multiple cycles. The graph below shows the results of the output reaching a steady oscillation after 5 days. What is constant is the degree of oscillation between the on and off stages.
 This type of intermittent loading prevents the filter from becoming saturated. With the intermittent loading pattern, the filter can be used without ever having to replace it since the filter never reaches a saturated state. The GAC filter is mainly used in line with the bio-filter, which requires a consistent flow of contaminants.
When comparing this data with that of Dr. Moe, it again can be seen that the results obtained mirror his. This means that the programming and equations are still accurate.