Fall 2006 Capstone Project: Reconstruction and stability analysis of human gait time series
Project description
The understanding of human gait is an active research topic. New approaches reveal the need to apply more sophisticated mathematical tools as the data acquisition processes improves.
This biological process is believed to be in large part regulated by an “open-loop” control mechanism. This suggests that the behavior of the system is not critically dependent upon sensory feedback from the peripheral nervous system. However, mounting evidence suggests an active role of somatosensory feedback arising from plantar cutaneous receptors in foot. To gain a better understanding of this problem, an attempt was made to determine the effects of reduced plantar sensitivity on gait.
The mathematical approach to analyze the data follows the ideas from chaotic dynamical systems. The collected data is a nonlinear time series, with underlying dynamics for which an explicit formulation is not available. The idea then is to arrange the data in a suitable way so that it is possible to extract some information about its complexity or possible chaotic behavior. This process is called attractor reconstruction. Once reconstructed, the largest Lyapunov exponent of the attractor is computed, which is a measurement of the instability of the underlying dynamics of the time series.
Data acquisition process
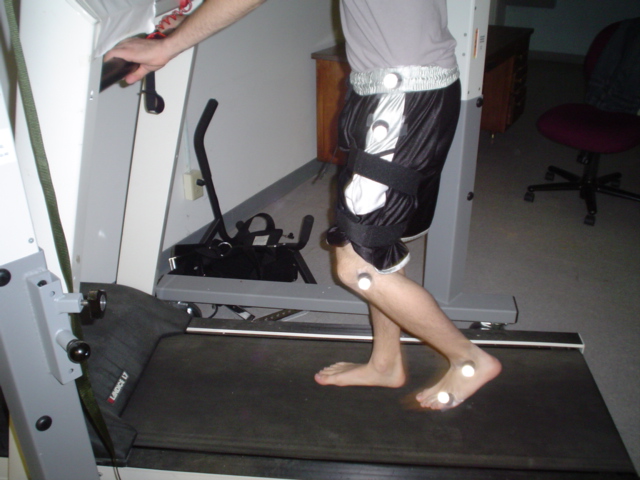
Healthy college-aged participants (six men, seven women) completed two minute bouts of preferred speed treadmill walking under both normal and desensitized conditions.
Desensitization was induced by exposure of the foot soles to shaved ice, and sensory loss was assessed by determining pressure detection threshold at five sites on the plantar aspect of the foot using a 5.07 gauge monofilament.
Sagittal-plane joint position data were acquired using one high-speed camera (60 Hz) and reflective markers placed at the hip, knee, and ankle joints. Continuous knee joint angles were computed over 45 consecutive strides.
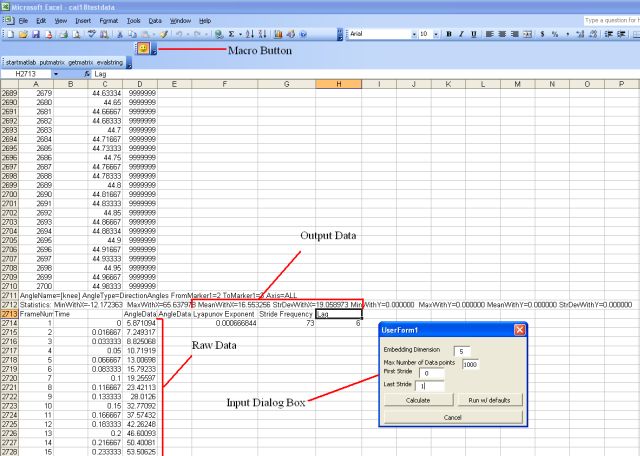
Finally, the data is stored in an Excel spreadsheet. This is a plot of the knee angle data for a particular subject.

Goals
The main goal of this project was to create a software package with the following features:
- Effective computation of the maximum Lyapunov exponent of the time series, a quantitative measure of local stability.
- A Graphical User Interface (GUI) to allow the user to handle the results with more flexibility and order.
- Enough documentation so that a larger audience would be able to use the software.
Algorithm and methods
We followed the algorithm described by Rosenstein to compute the largest Lyapunov exponent. Learn more about the Rosenstein algorithm. MATLAB routines were then created based on the descriptions given in that paper.
Let us briefly describe what the software does. The Excel macro inputs the data from Excel to MATLAB for analysis. The macro is equipped with default parameters, but users can input parameters such as the embedding dimension, and the starting and ending stride number (for computing the short-term or long-term Lyapunov exponents). The macro then sends the data to MATLAB, where it is run through a filter to remove erroneous data points at the beginning and end of the data set. The data is then tested to find the stride frequency. Finally, the program to find the Lyapunov exponent is run, and the stride frequency and Lyapunov exponent are returned to Excel.
You can also click on the link below to see a presentation poster with more info about the project.
| Attachment | Size |
|---|---|
| 275 KB |