Fall 2003 Capstone Project: Mathematical Model Of Systolic Blood Pressure Fluctuations
For ages, medical science has always used biological explanations. And now, the expansion of medicine is leading to a new path, the use of mathematical modeling to explain physiological patterns. The objective of this project is to model normal, healthy blood pressure curves using mathematical programs. The ability to perform such a task will lead to any deviations from the normal curve being connected to certain health problems. Being able to detect health problems in their early stages, can help doctors treat patients before their health affects their life in a bad way.
Our interest in this project stems from the concept of using mathematics to explain human physiology. With our wide mathematical background and our knowledge of computer science, we can develop an approach to modeling physiology, particularly the diastole of blood pressure.
Further developments in this research included questions about whether there could be more than one frequency acting on the data. We wrote a program to use the Fast Fourier Transform to find the dominant frequencies. Our results indicate that there is more than one frequency acting in the data, but more data collection is needed to confirm this founding. A next step would be adjusting the model appropriately to reflect the correct frequencies.
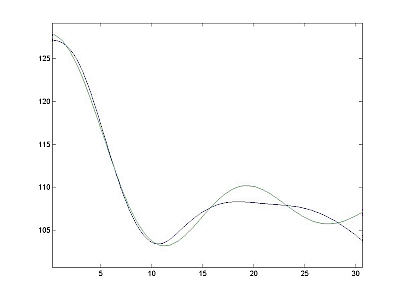 |
| Shown in the blue is the actual blood pressure of an individual, over a 30 sec period, at rest after exercising for several minutes. This is the first oscillation of many in a person's blood pressure after exercising. |
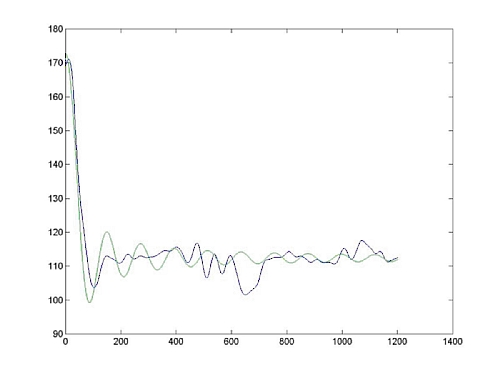 |
| Shown in the blue is the actual blood pressure, over a 5 min. period, of an individual who is at rest after several minutes of exercising. The data was fit to the mathematical model shown in the green. The results are the parameters being used by the LSU Kinesiology Department. |
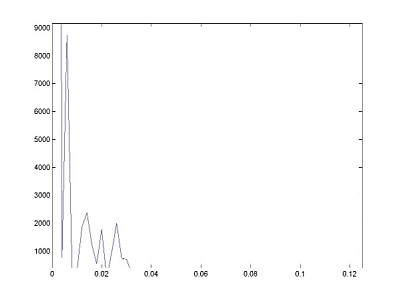 |
| This represents FFT analysis of the normalized data set. We see the frequency power graph. It indicates that there are four close frequencies interfering in the data. |