Graphical User Interface
Graphical User Interface
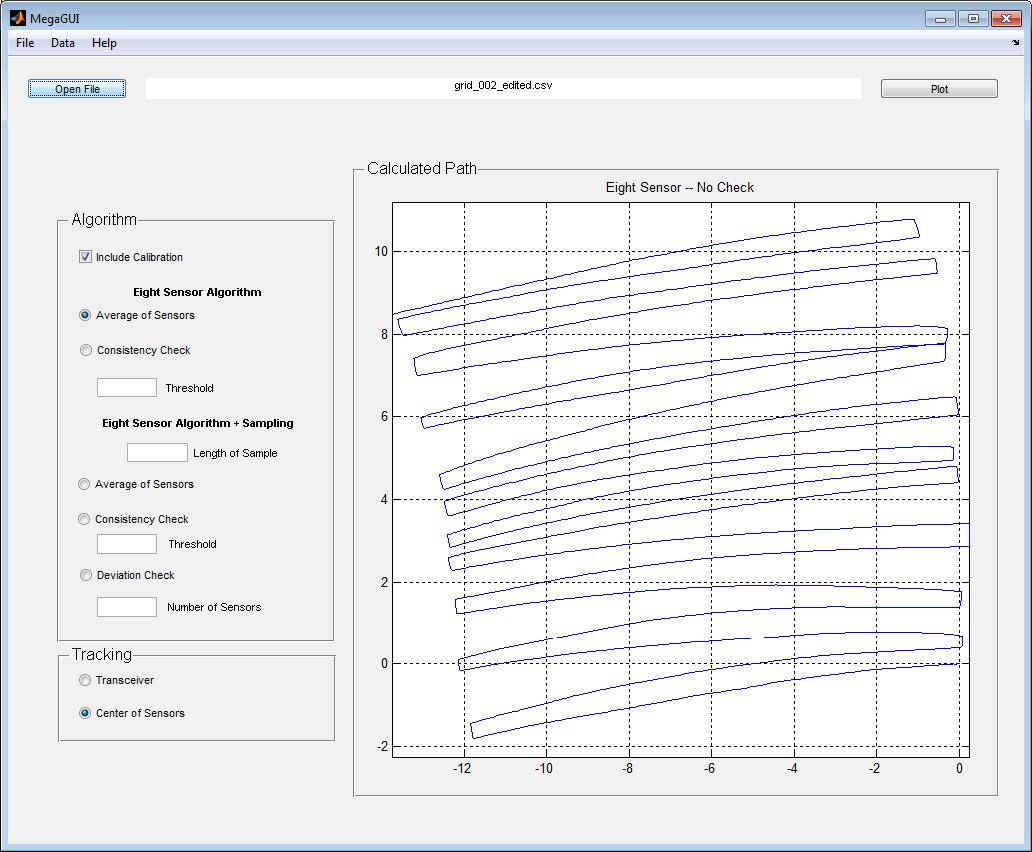
Below is a screen shot of the graphical user interface (GUI). On the left hand side are a number of options which use different algorithms to output a path for the puck.
- Include Calibration.
- This option allows users to include the parameters of the puck as calculated in the calibration method. If this is not selected, the program will assume the puck has a perfect construction with the orientation, position, and sensitivity as called for in the design. It is recommended that the user include the calibration as it has shown to improve the results for almost any path. However, if one is running generated data, one should not use the calibration. Generated data is based on the perfect puck construction.
- Eight Sensor Algorithm
- In the Eight Sensor Algorithm area are options to track the path of the puck using updated position and orientation at each time step.
- Average of Sensors
- Average of Sensor takes the average of the new position and orientation as calculated by each sensor pair.
- Consistency Check
- Unlike the Average of Sensors option, the Consistency Check does not take into account all sensor pairs when reconstructing the path. Instead, at each step the algorithm throws out those readings which are inconsistent with the rigid body constraints of the puck. The threshold allows users to specify the level of inconsistency tolerated by the program.
- Eight Sensor Algorithm + Sampling
- In this area includes beta versions of algorithms designed to reduce noise in the data. The position and orientation is updating using samples of time steps rather than at each step. The sample length is specified in the Length of Sample box.
- Average of Sensors
- This takes the average position and orientation as calculated by all sensors using the average inputs from sampling periods.
- Consistency Check
- This algorithm uses the average inputs form each sampling period to calculate which sensor pairs calculate paths consistent with the rigid body constraints of the device. Then, using those sensor pairs, the path is reconstructed. . The threshold allows users to specify the level of inconsistency tolerated by the program.
- Deviation Check
- This method discards sensors with highest standard deviation within samples. The remaining sensors are then used to reconstruct the path of the puck. The number of sensors kept at each sample is specified in the Number of Sensors box.
- Tracking
- This area allows users to track either the position and orientation of the microwave transceiver or the center of the sensors.