Results
Input Data
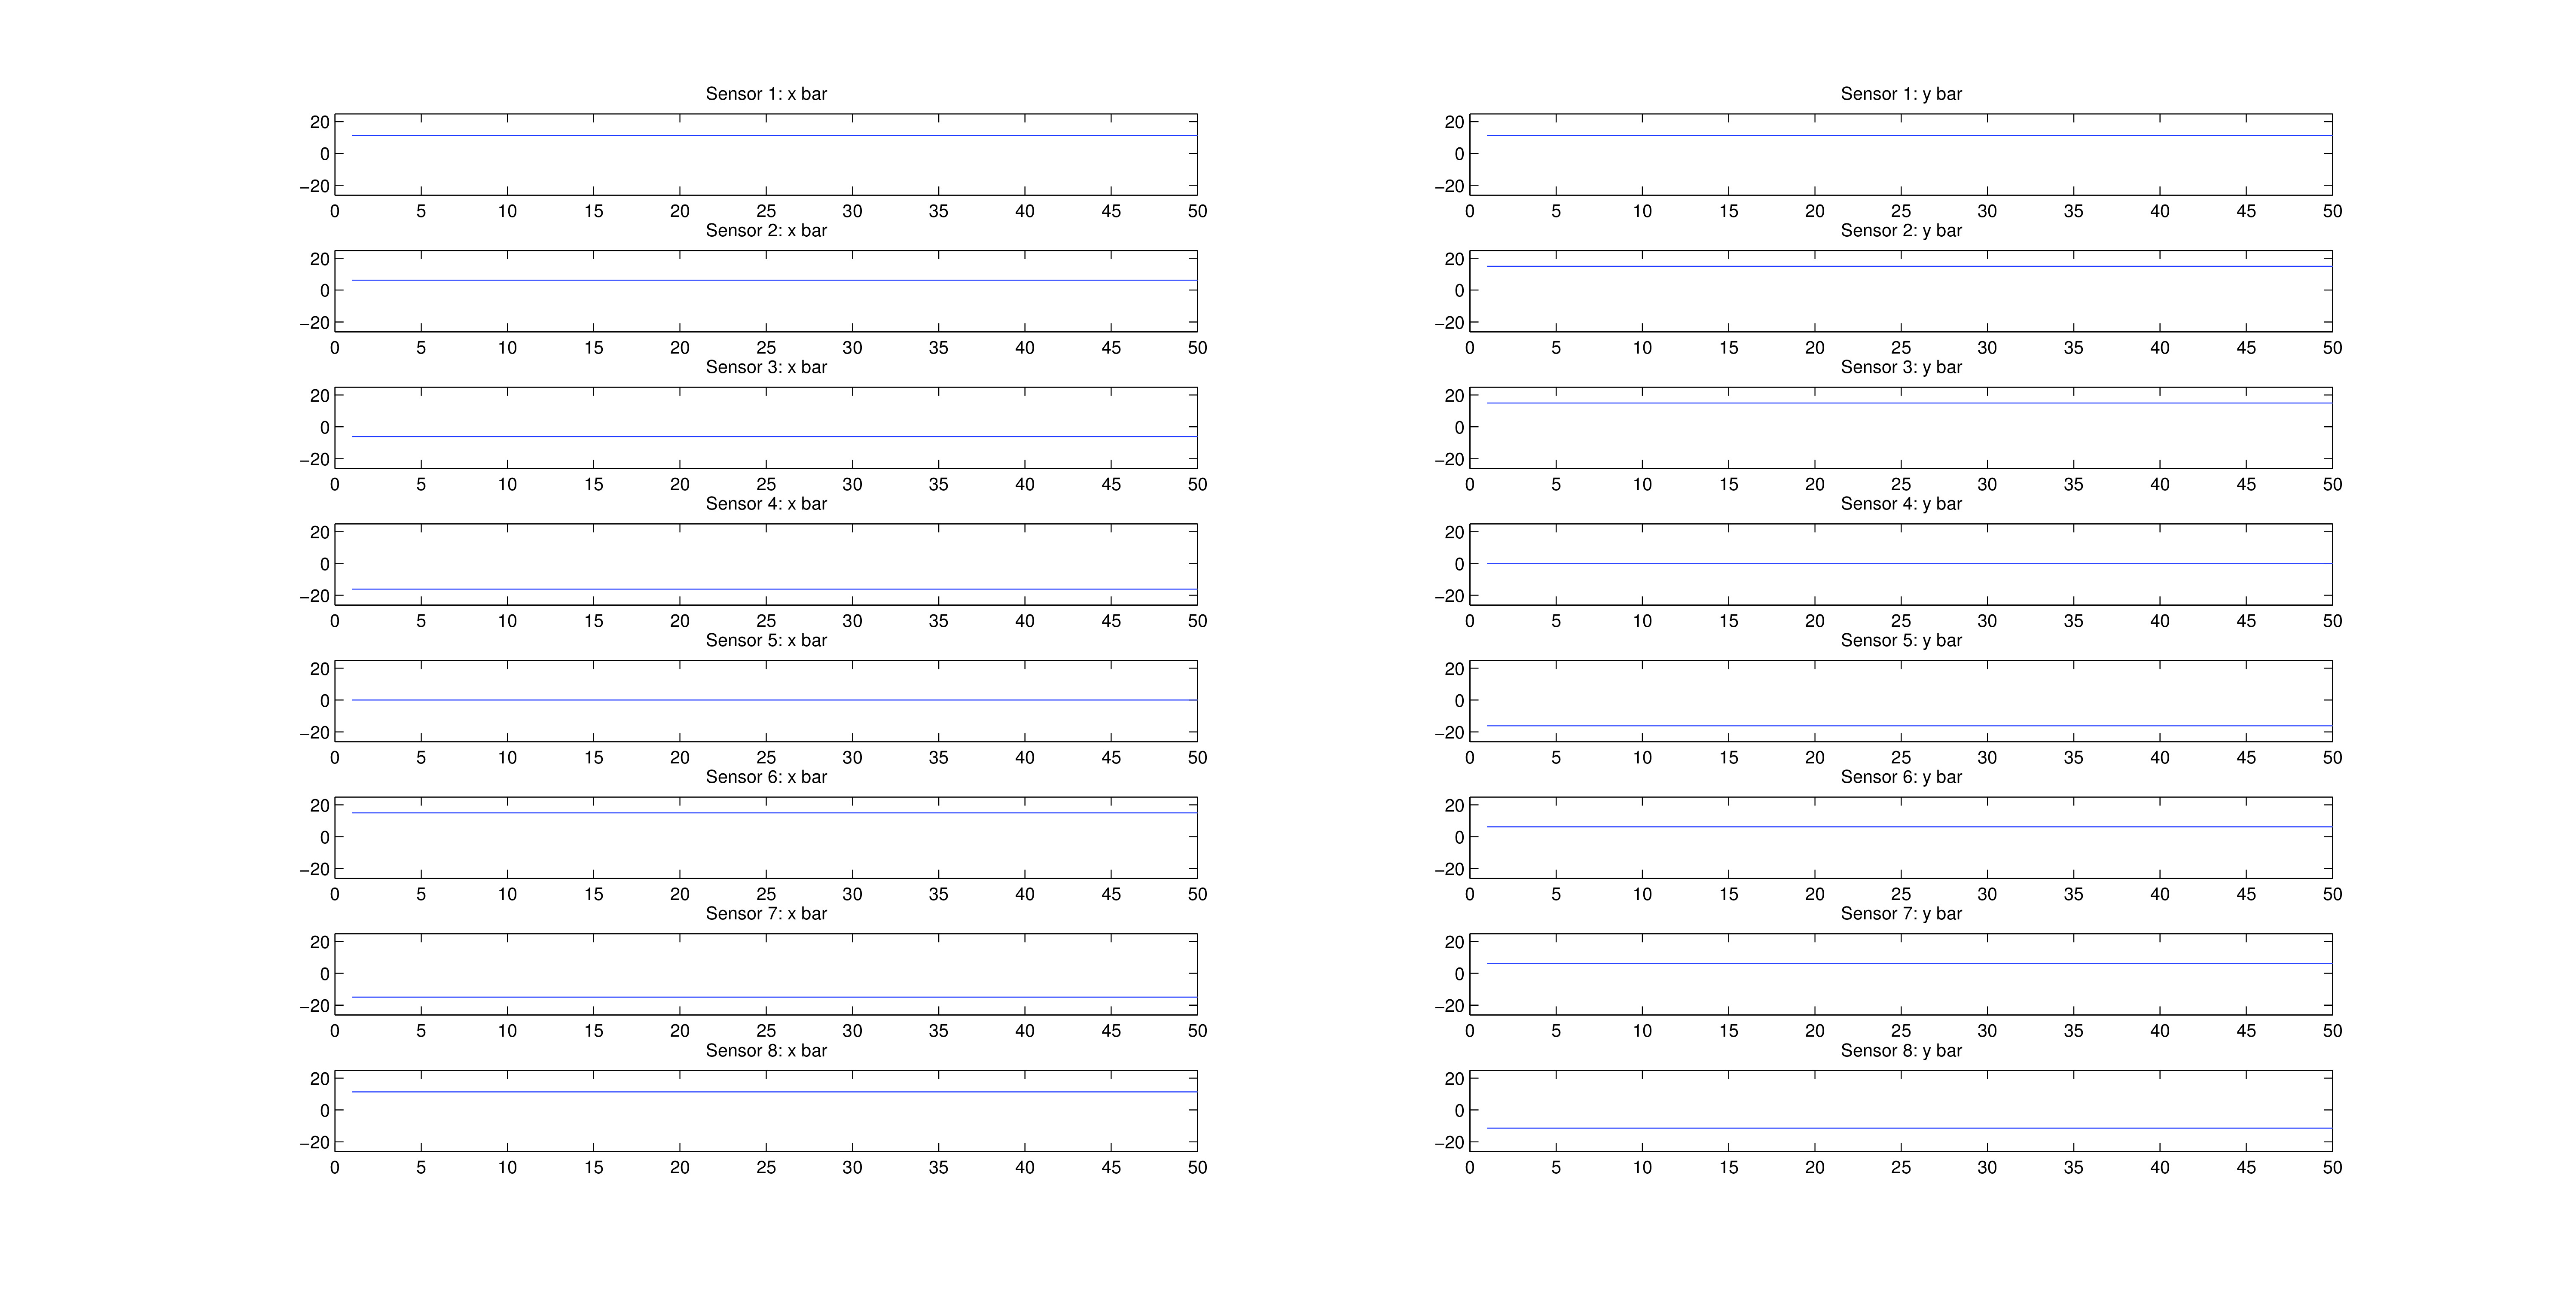
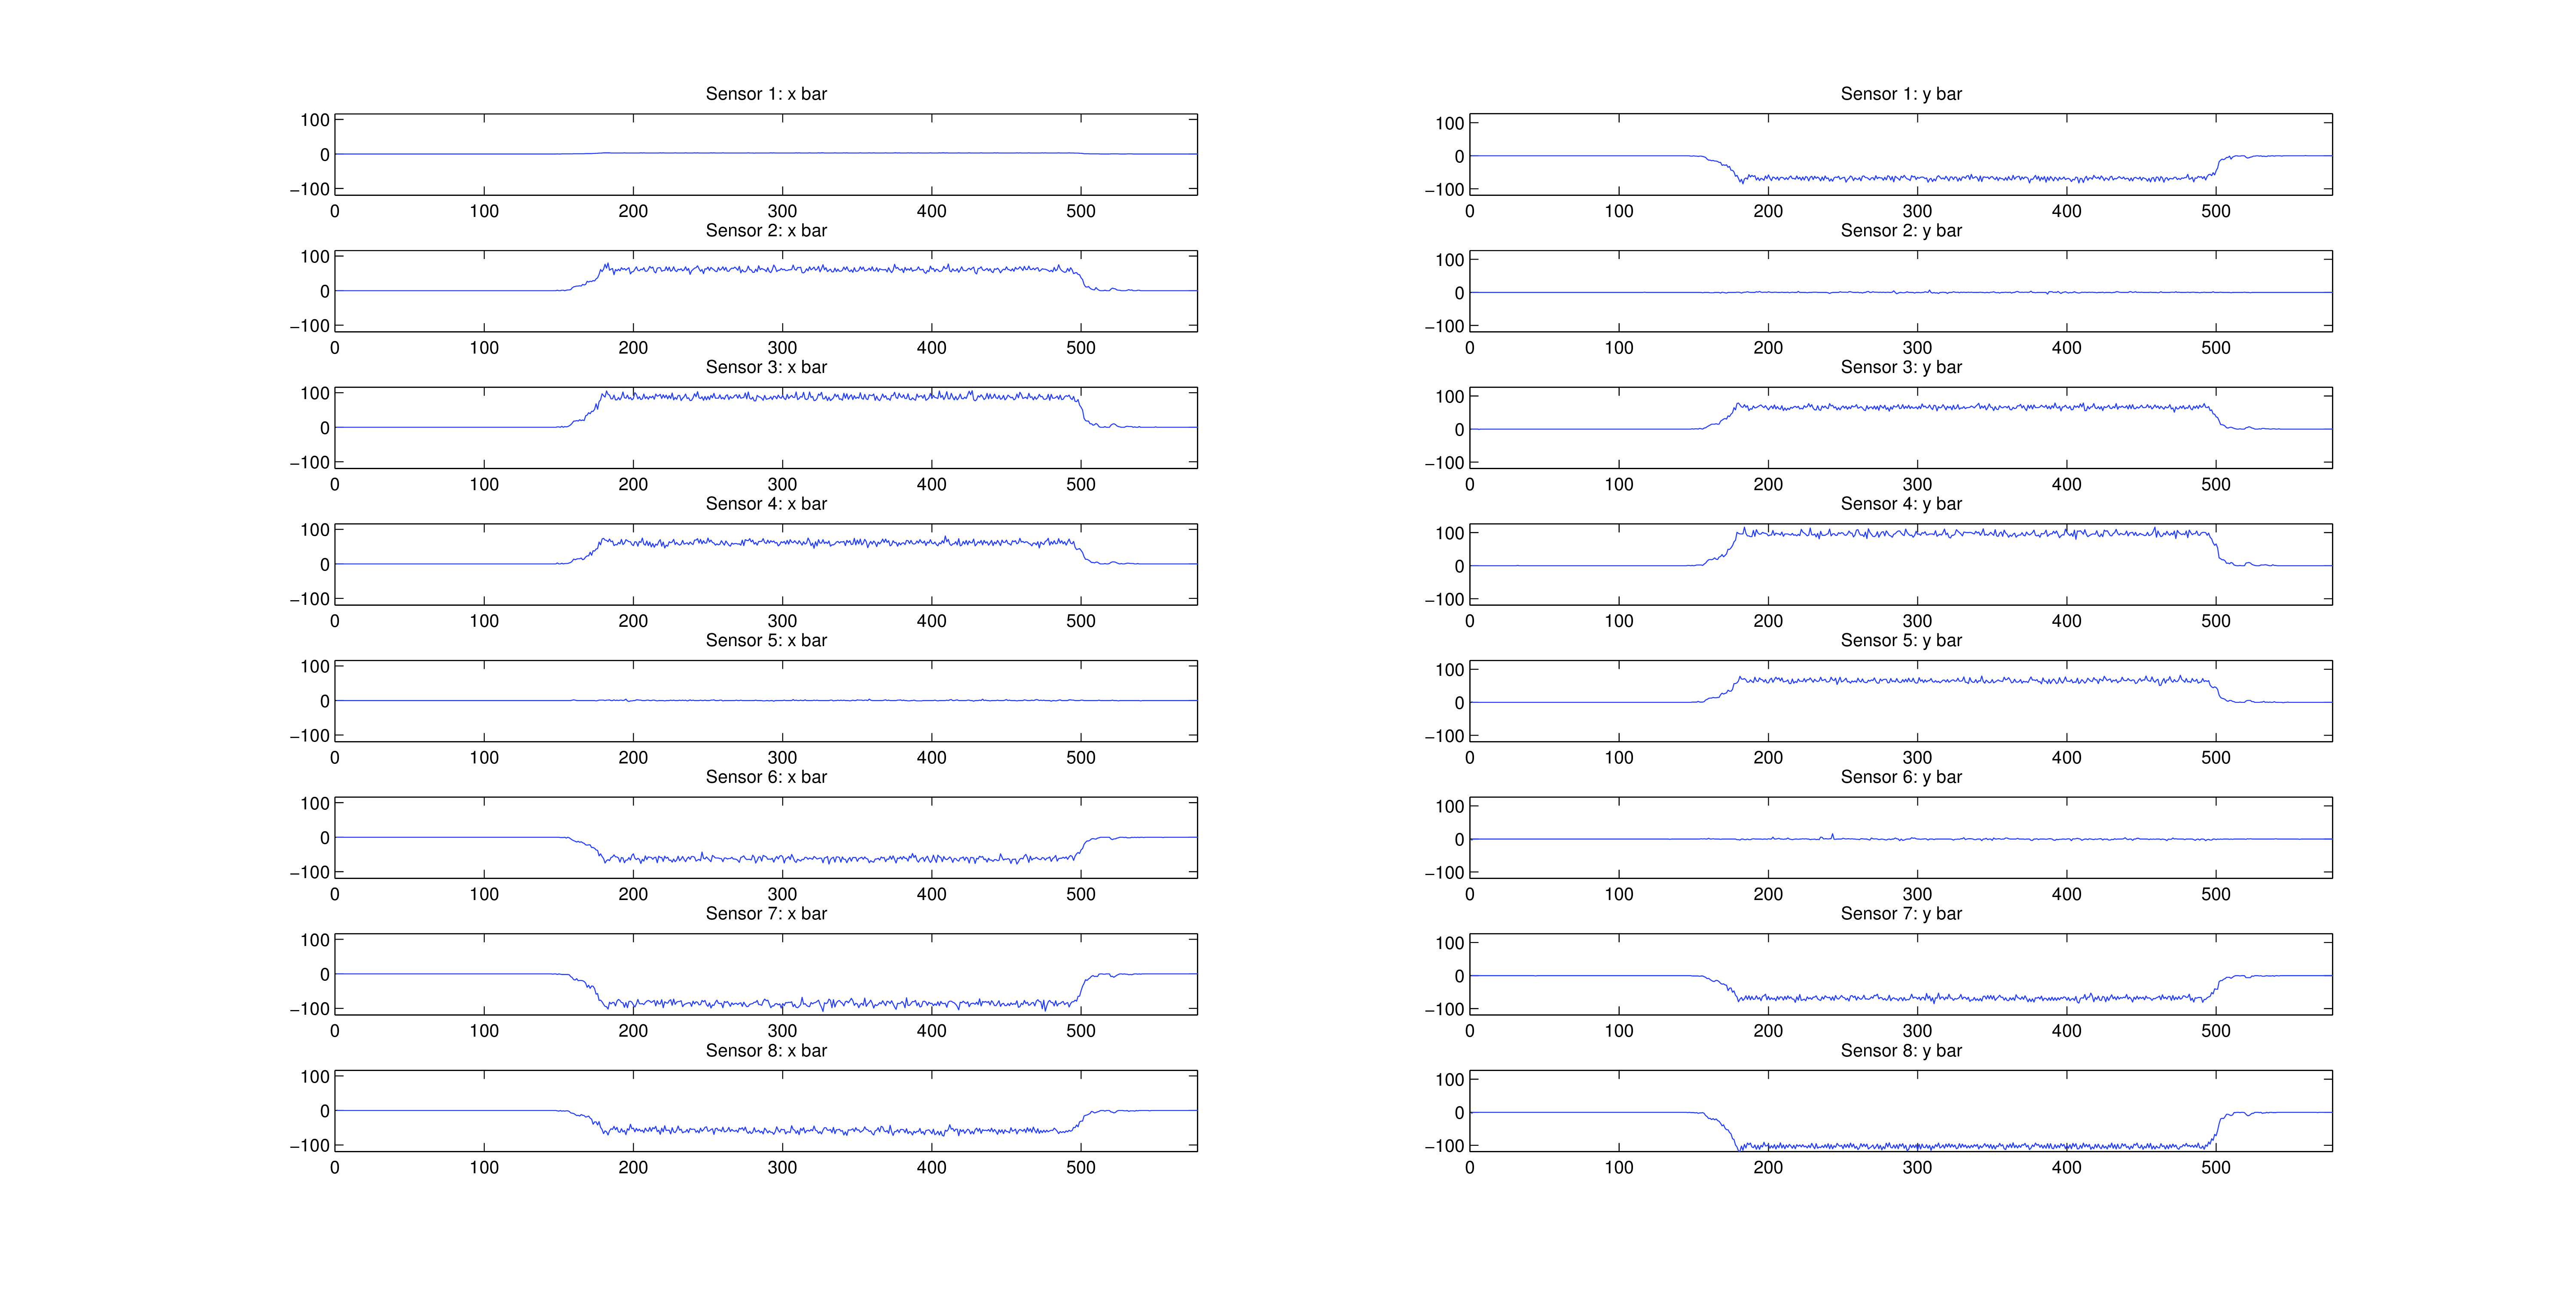
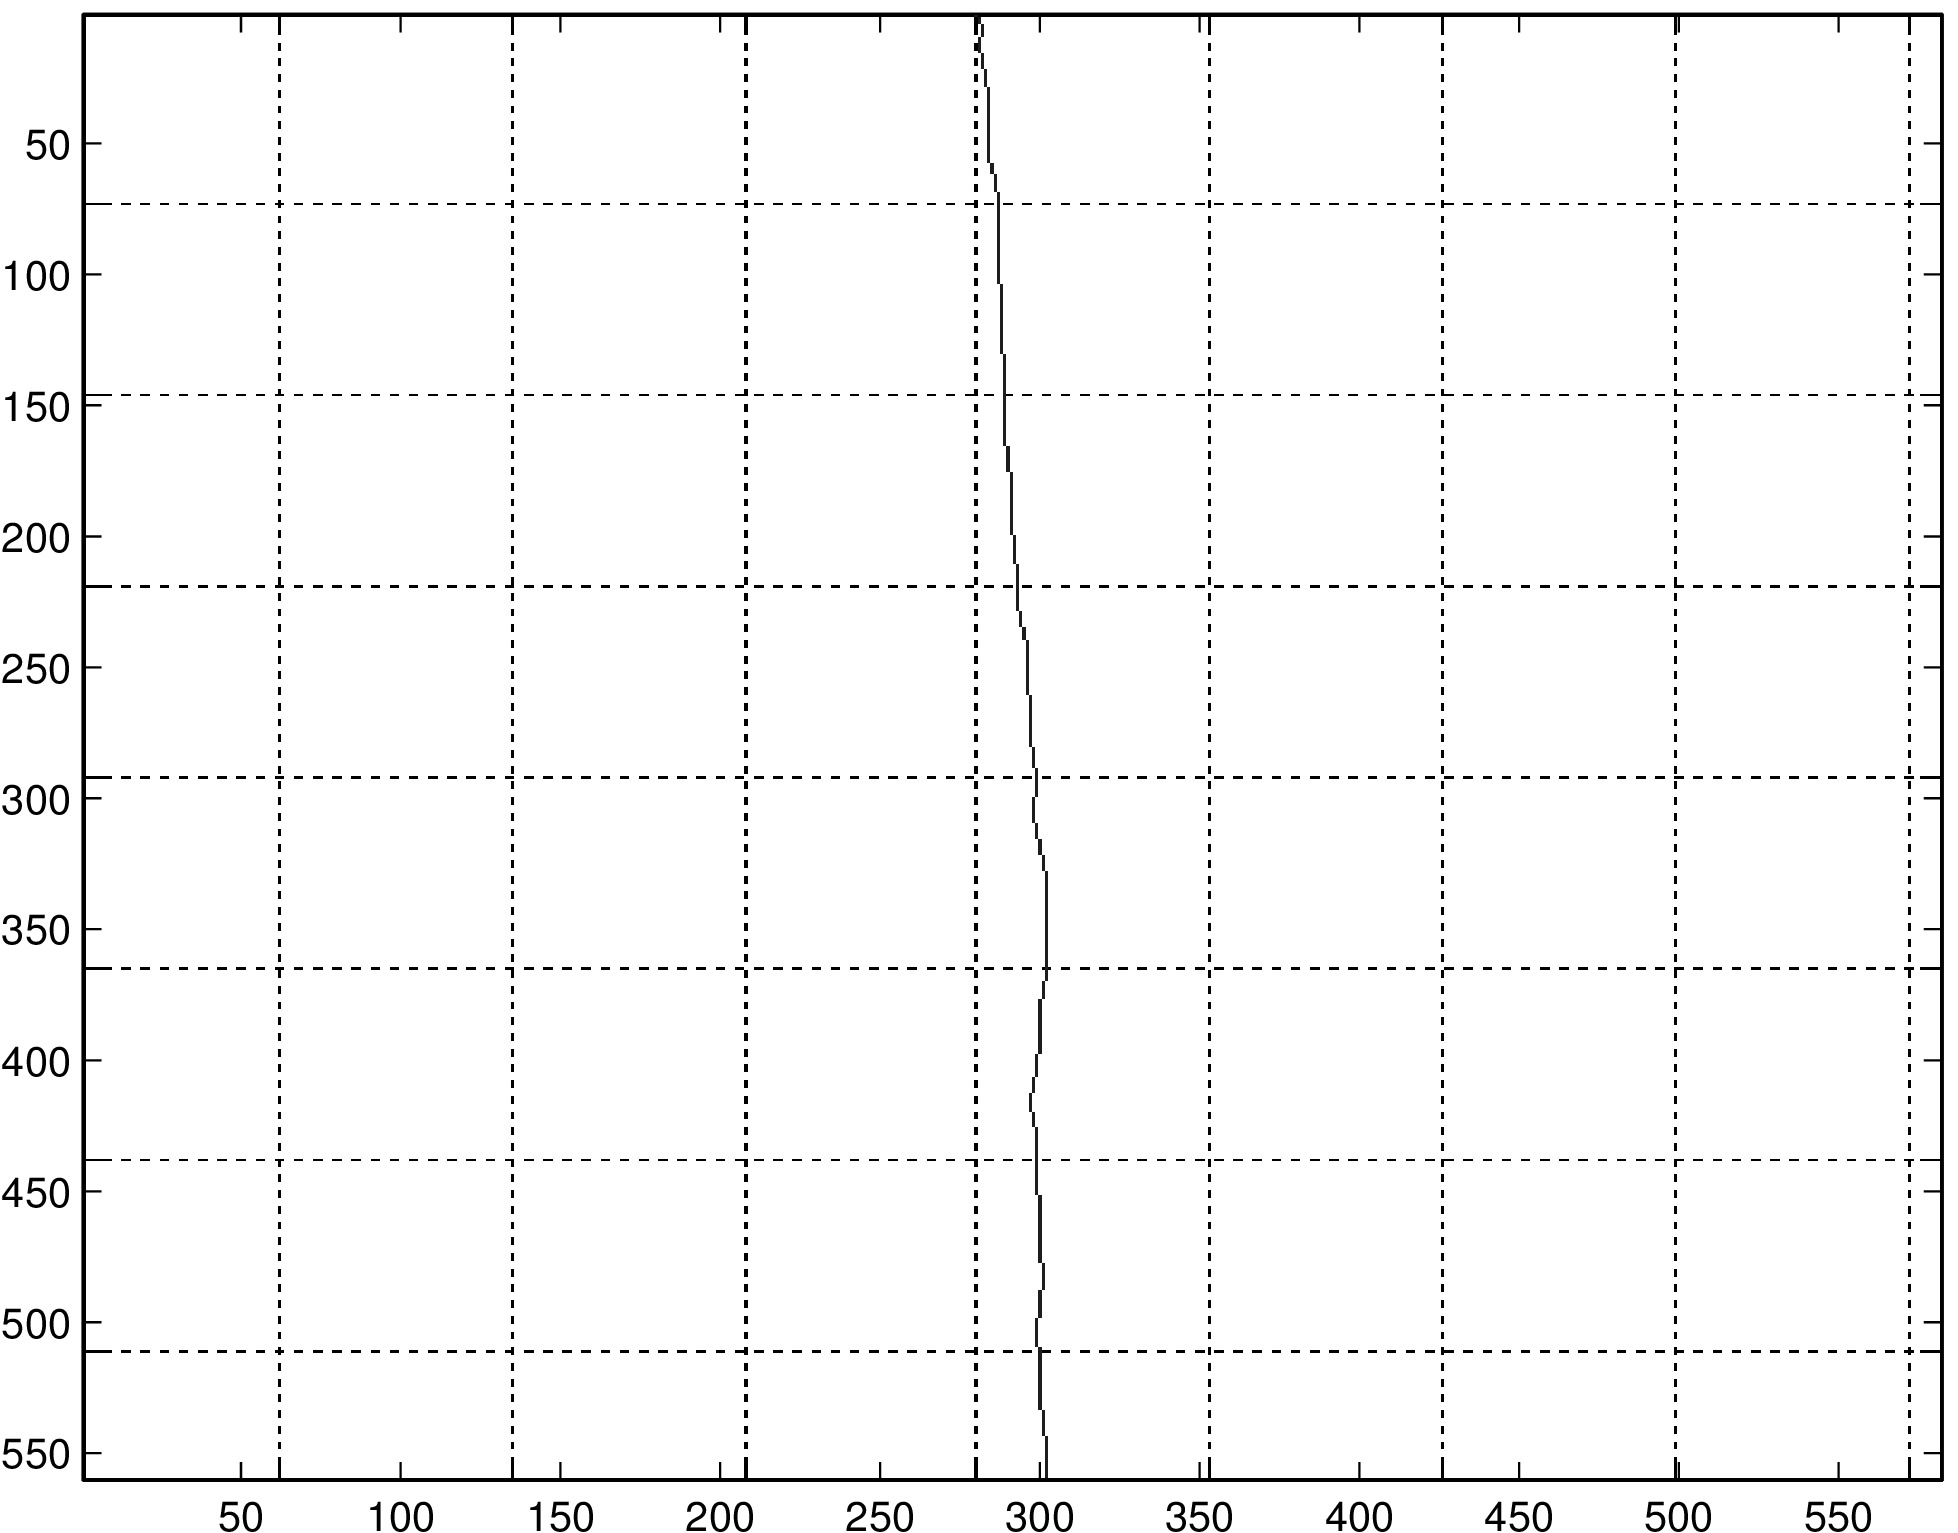
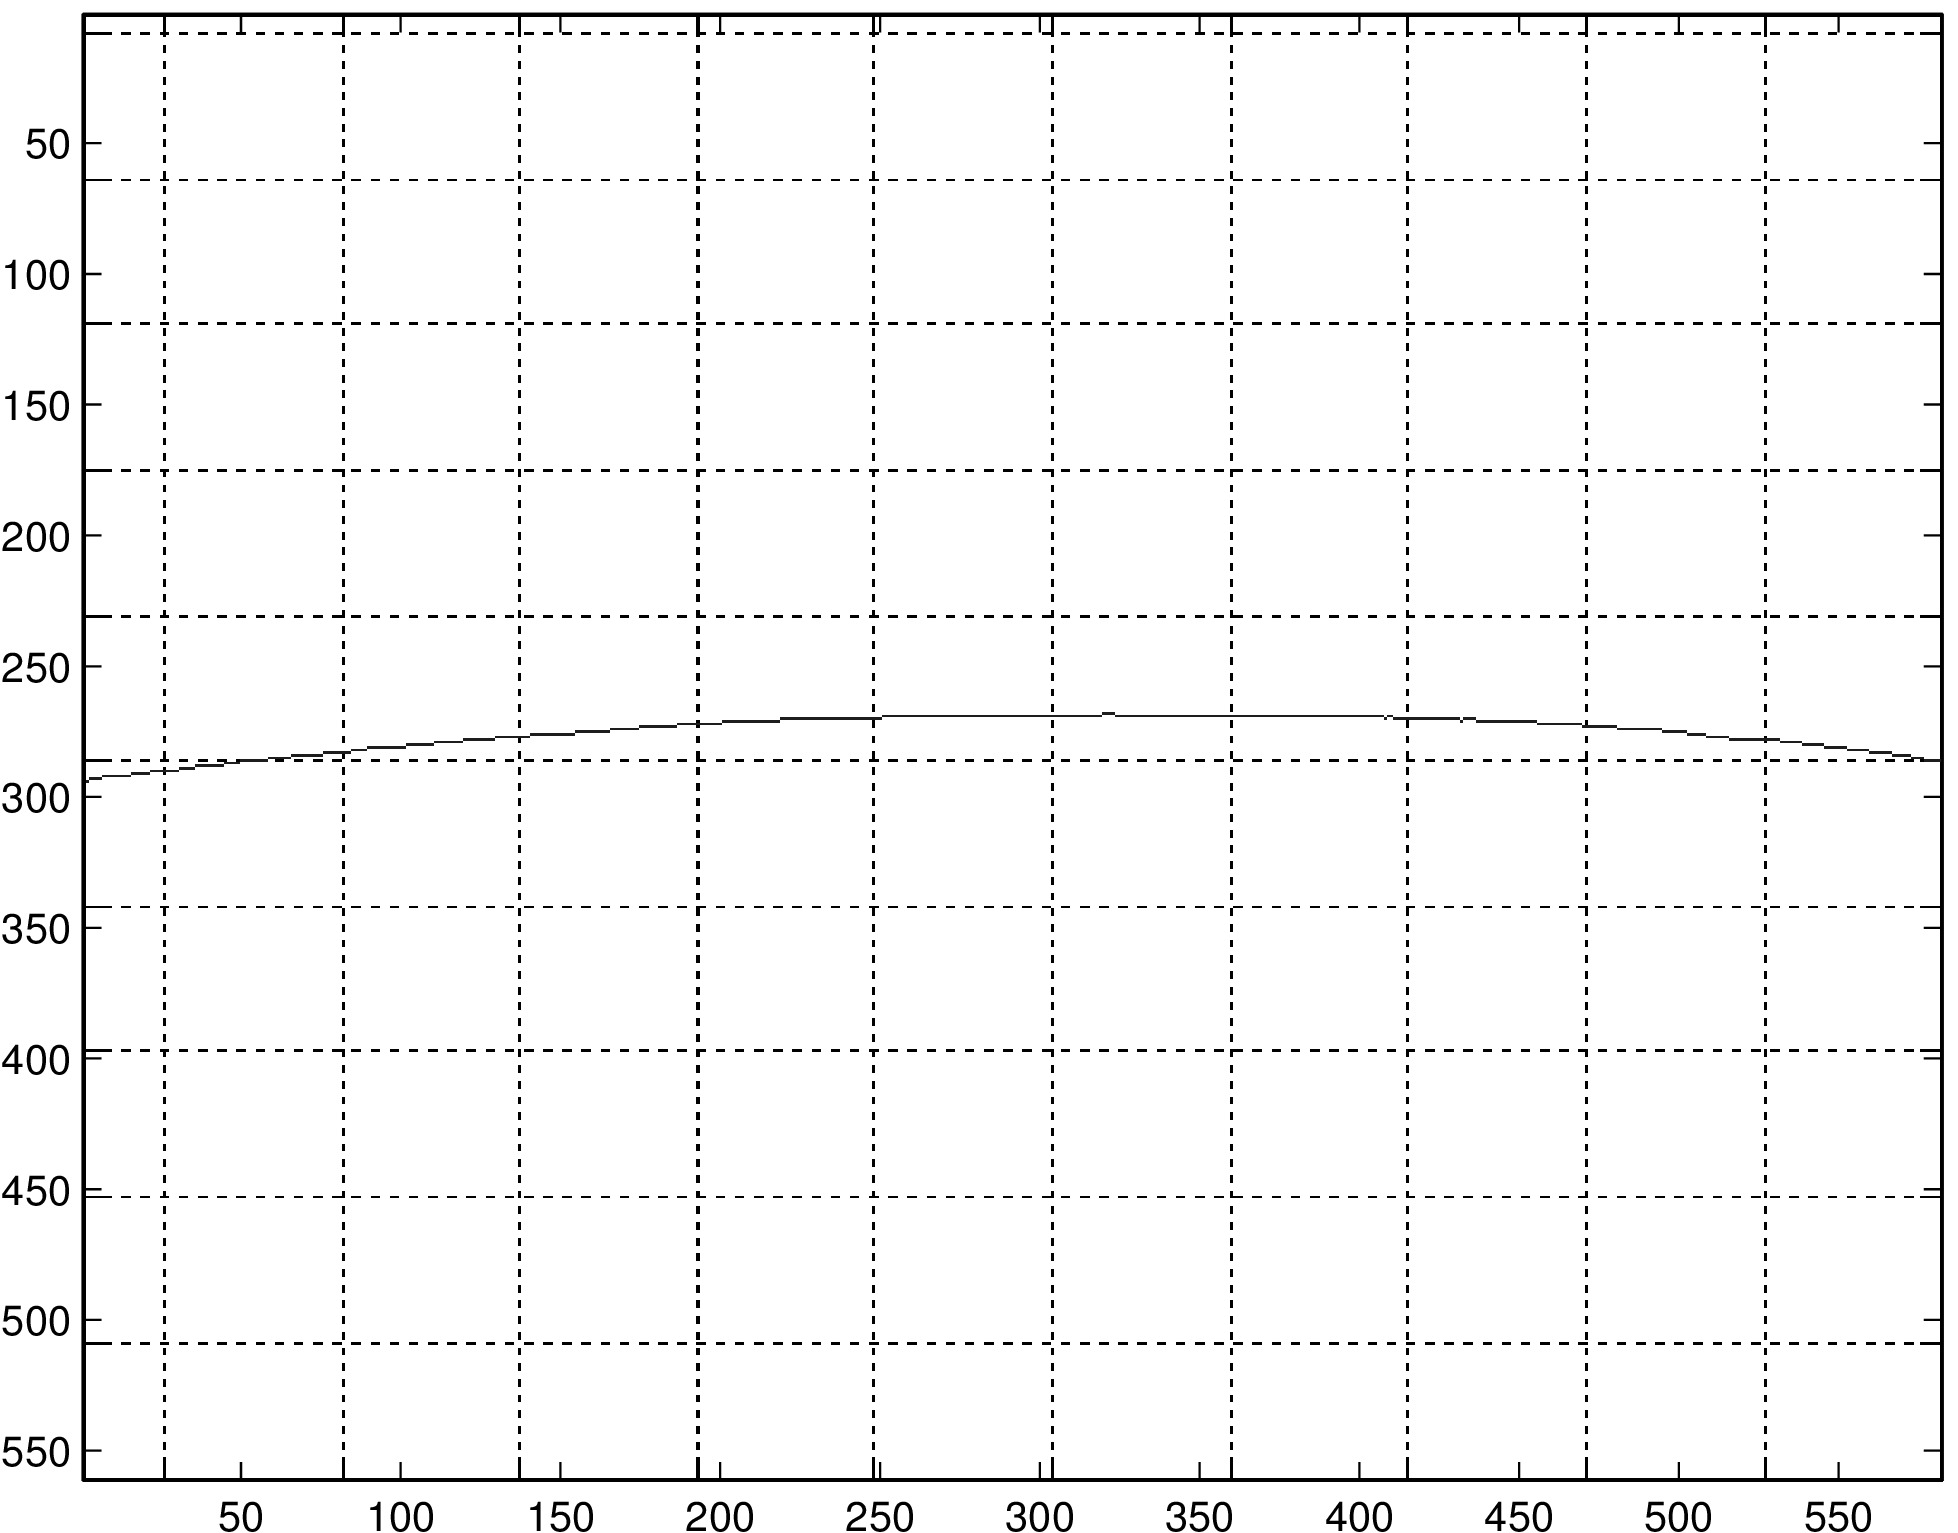
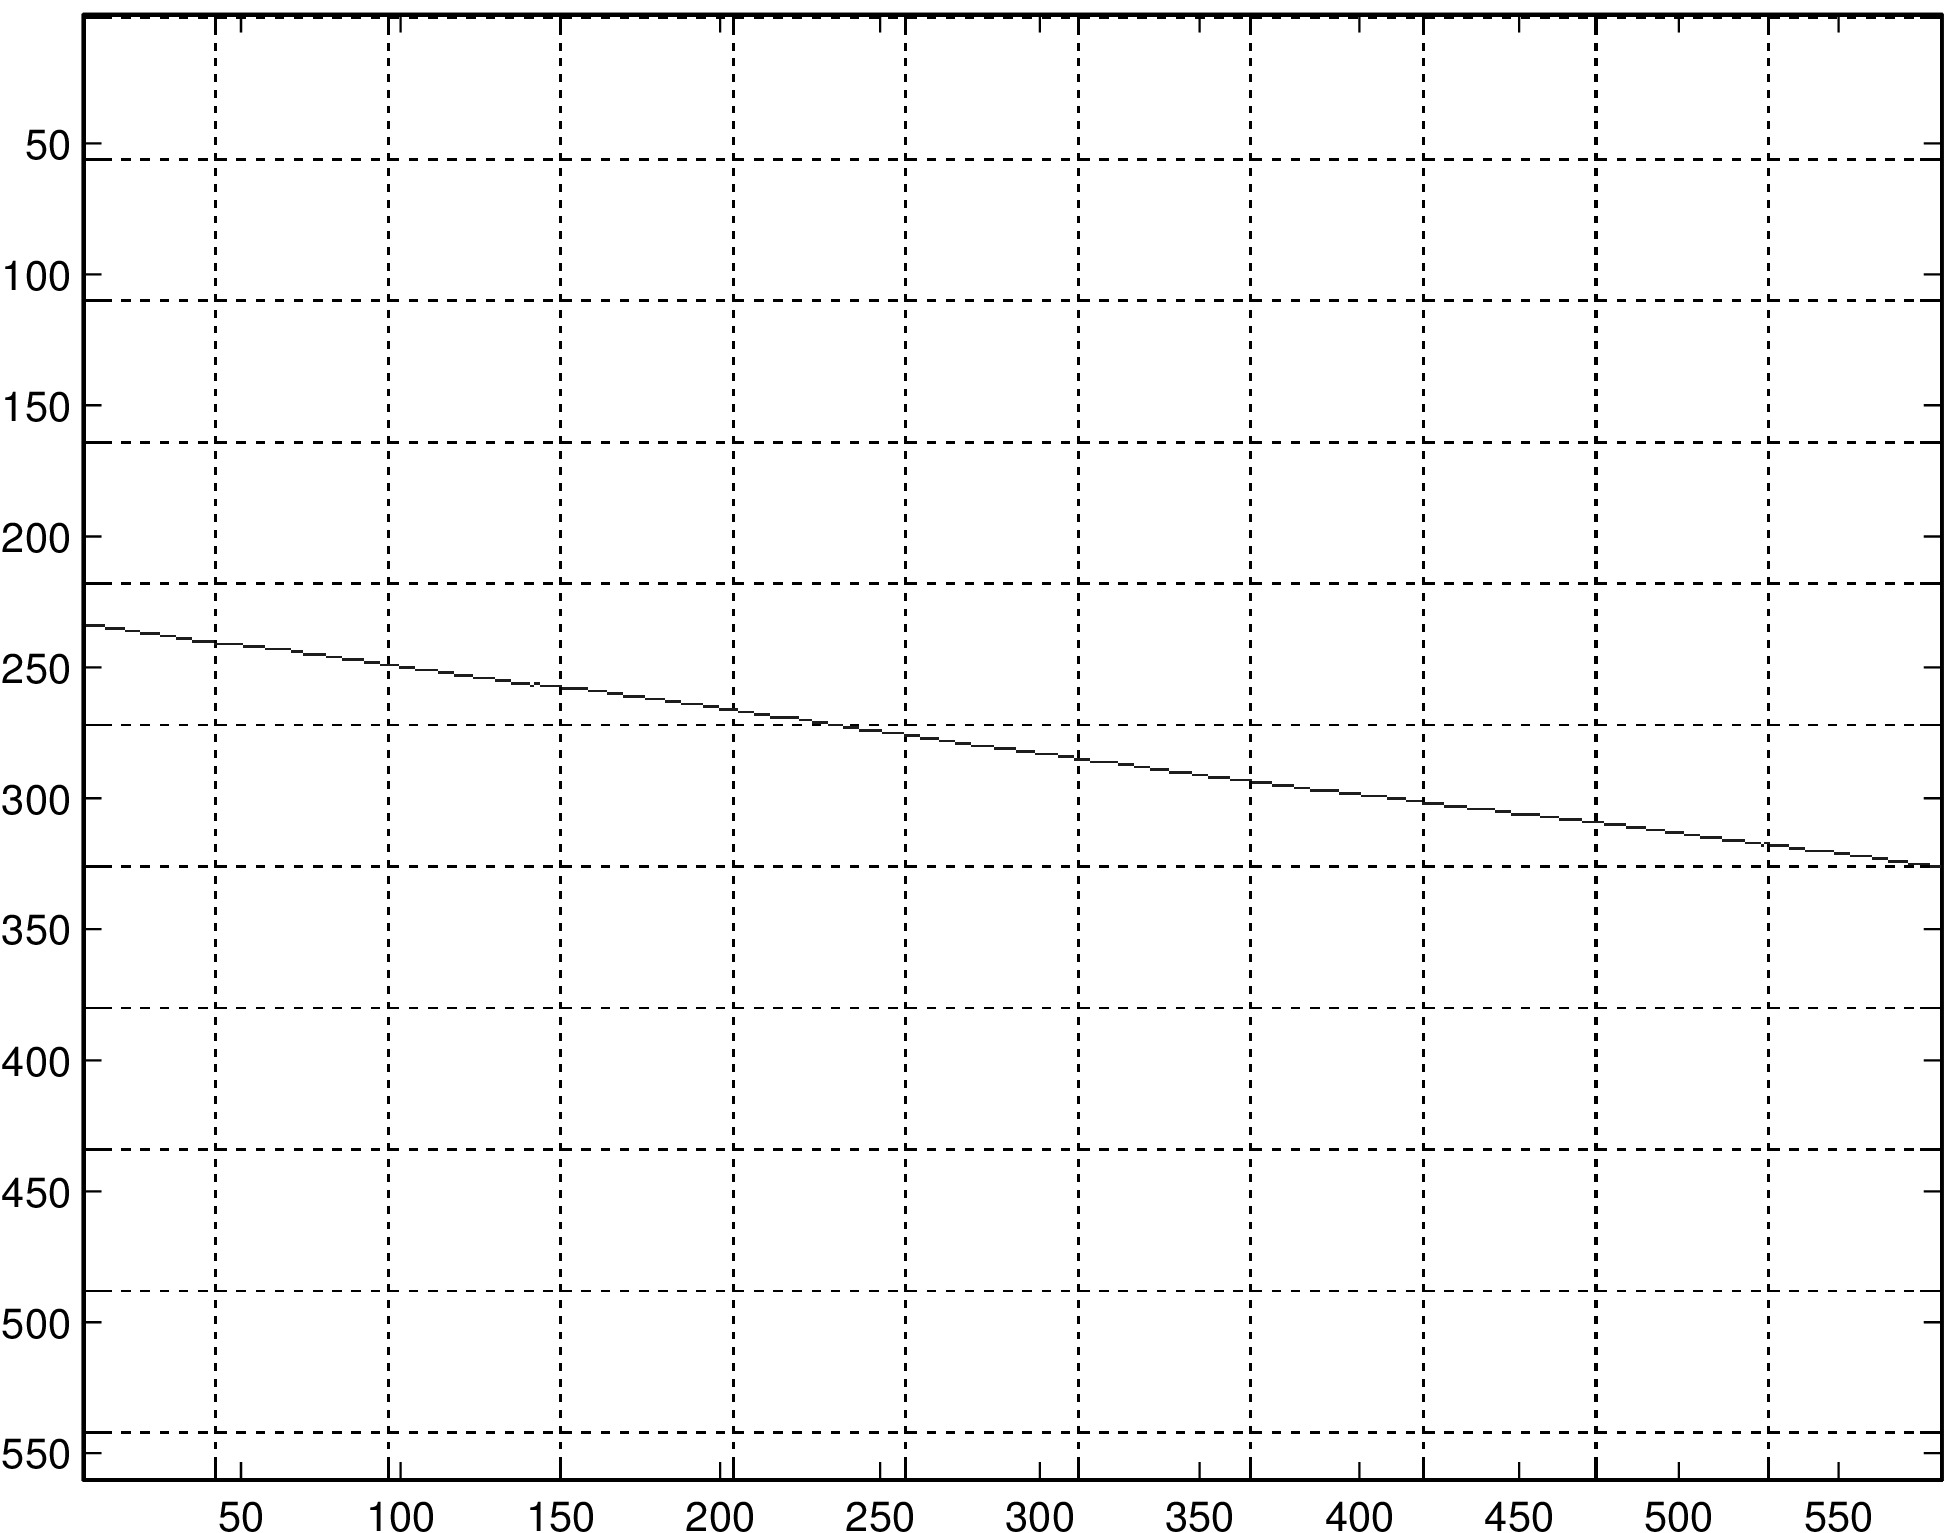
Figure 1 displays generated (ideal) x (left) and y (right) inputs for a diagonal line. Figure 2 displays true data from the puck for a (different) diagonal line. While true input data are noisy, preliminary attempts at noise reduction with median filtering did not improve path reconstructions, suggesting that noise is not contributing significantly to reconstruction inaccuracies. However it may be worthwhile to try more sophisticated smoothing techniques to improve the program.
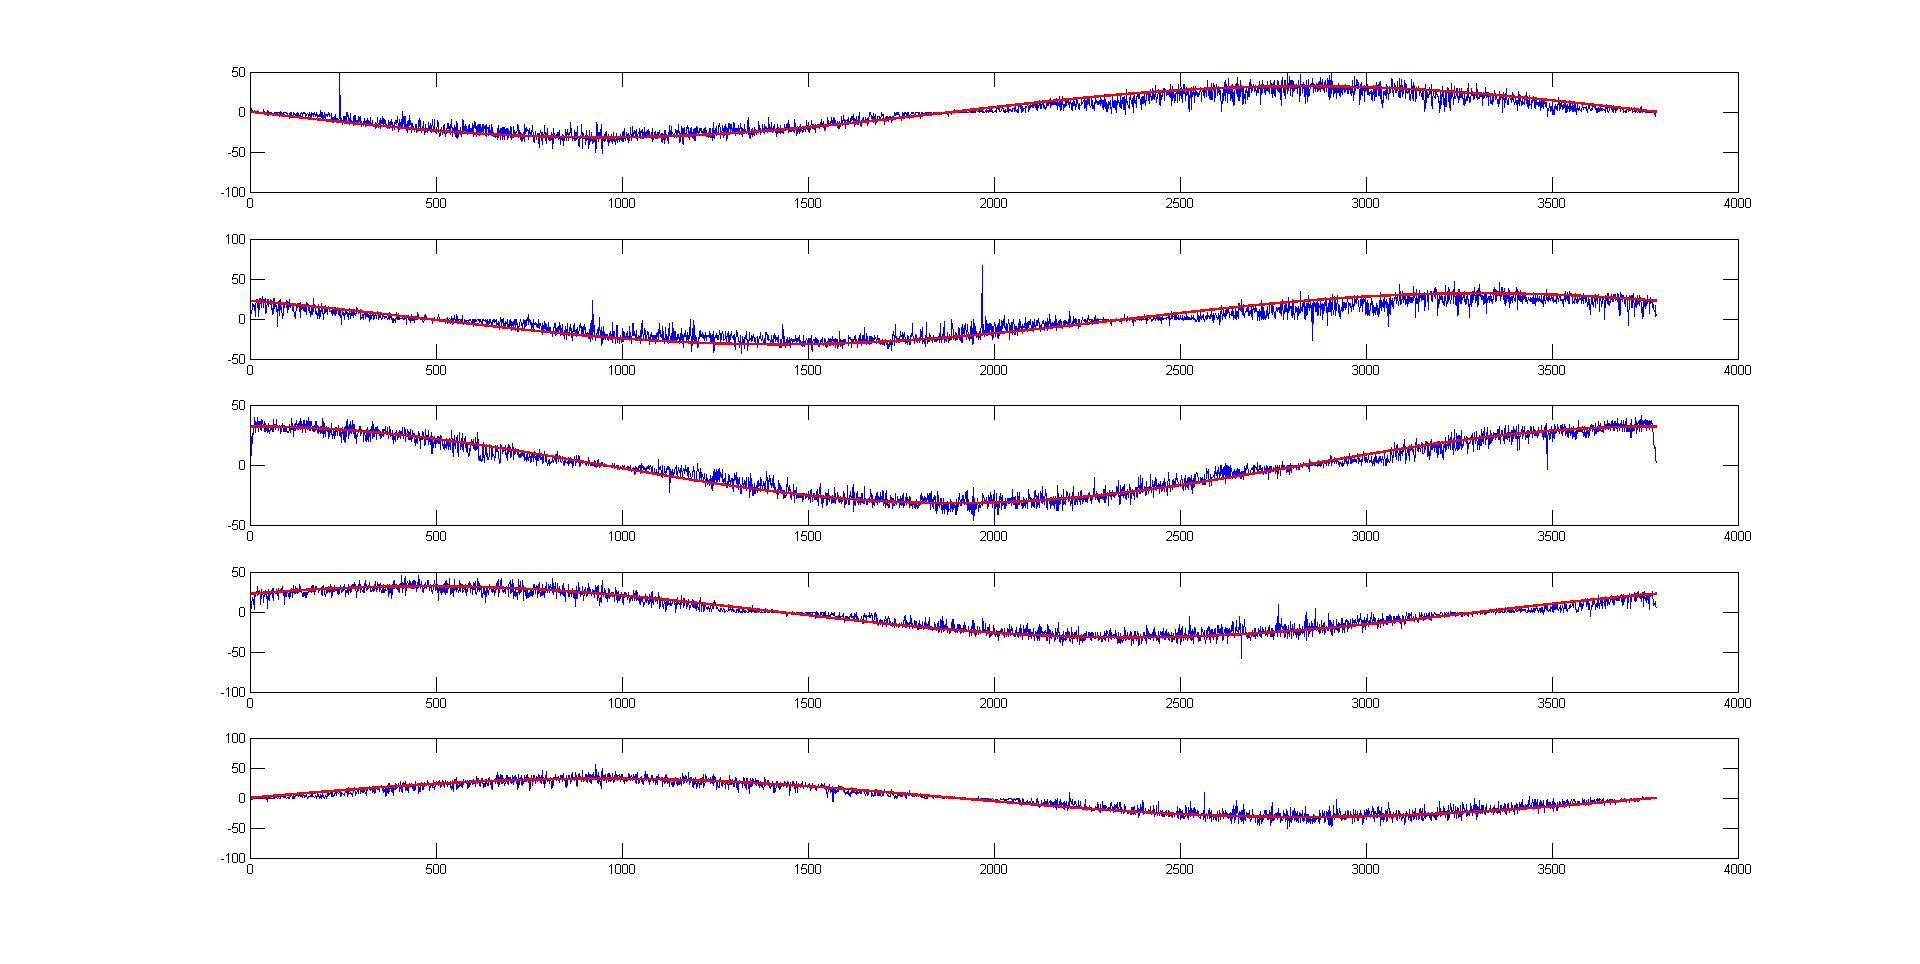
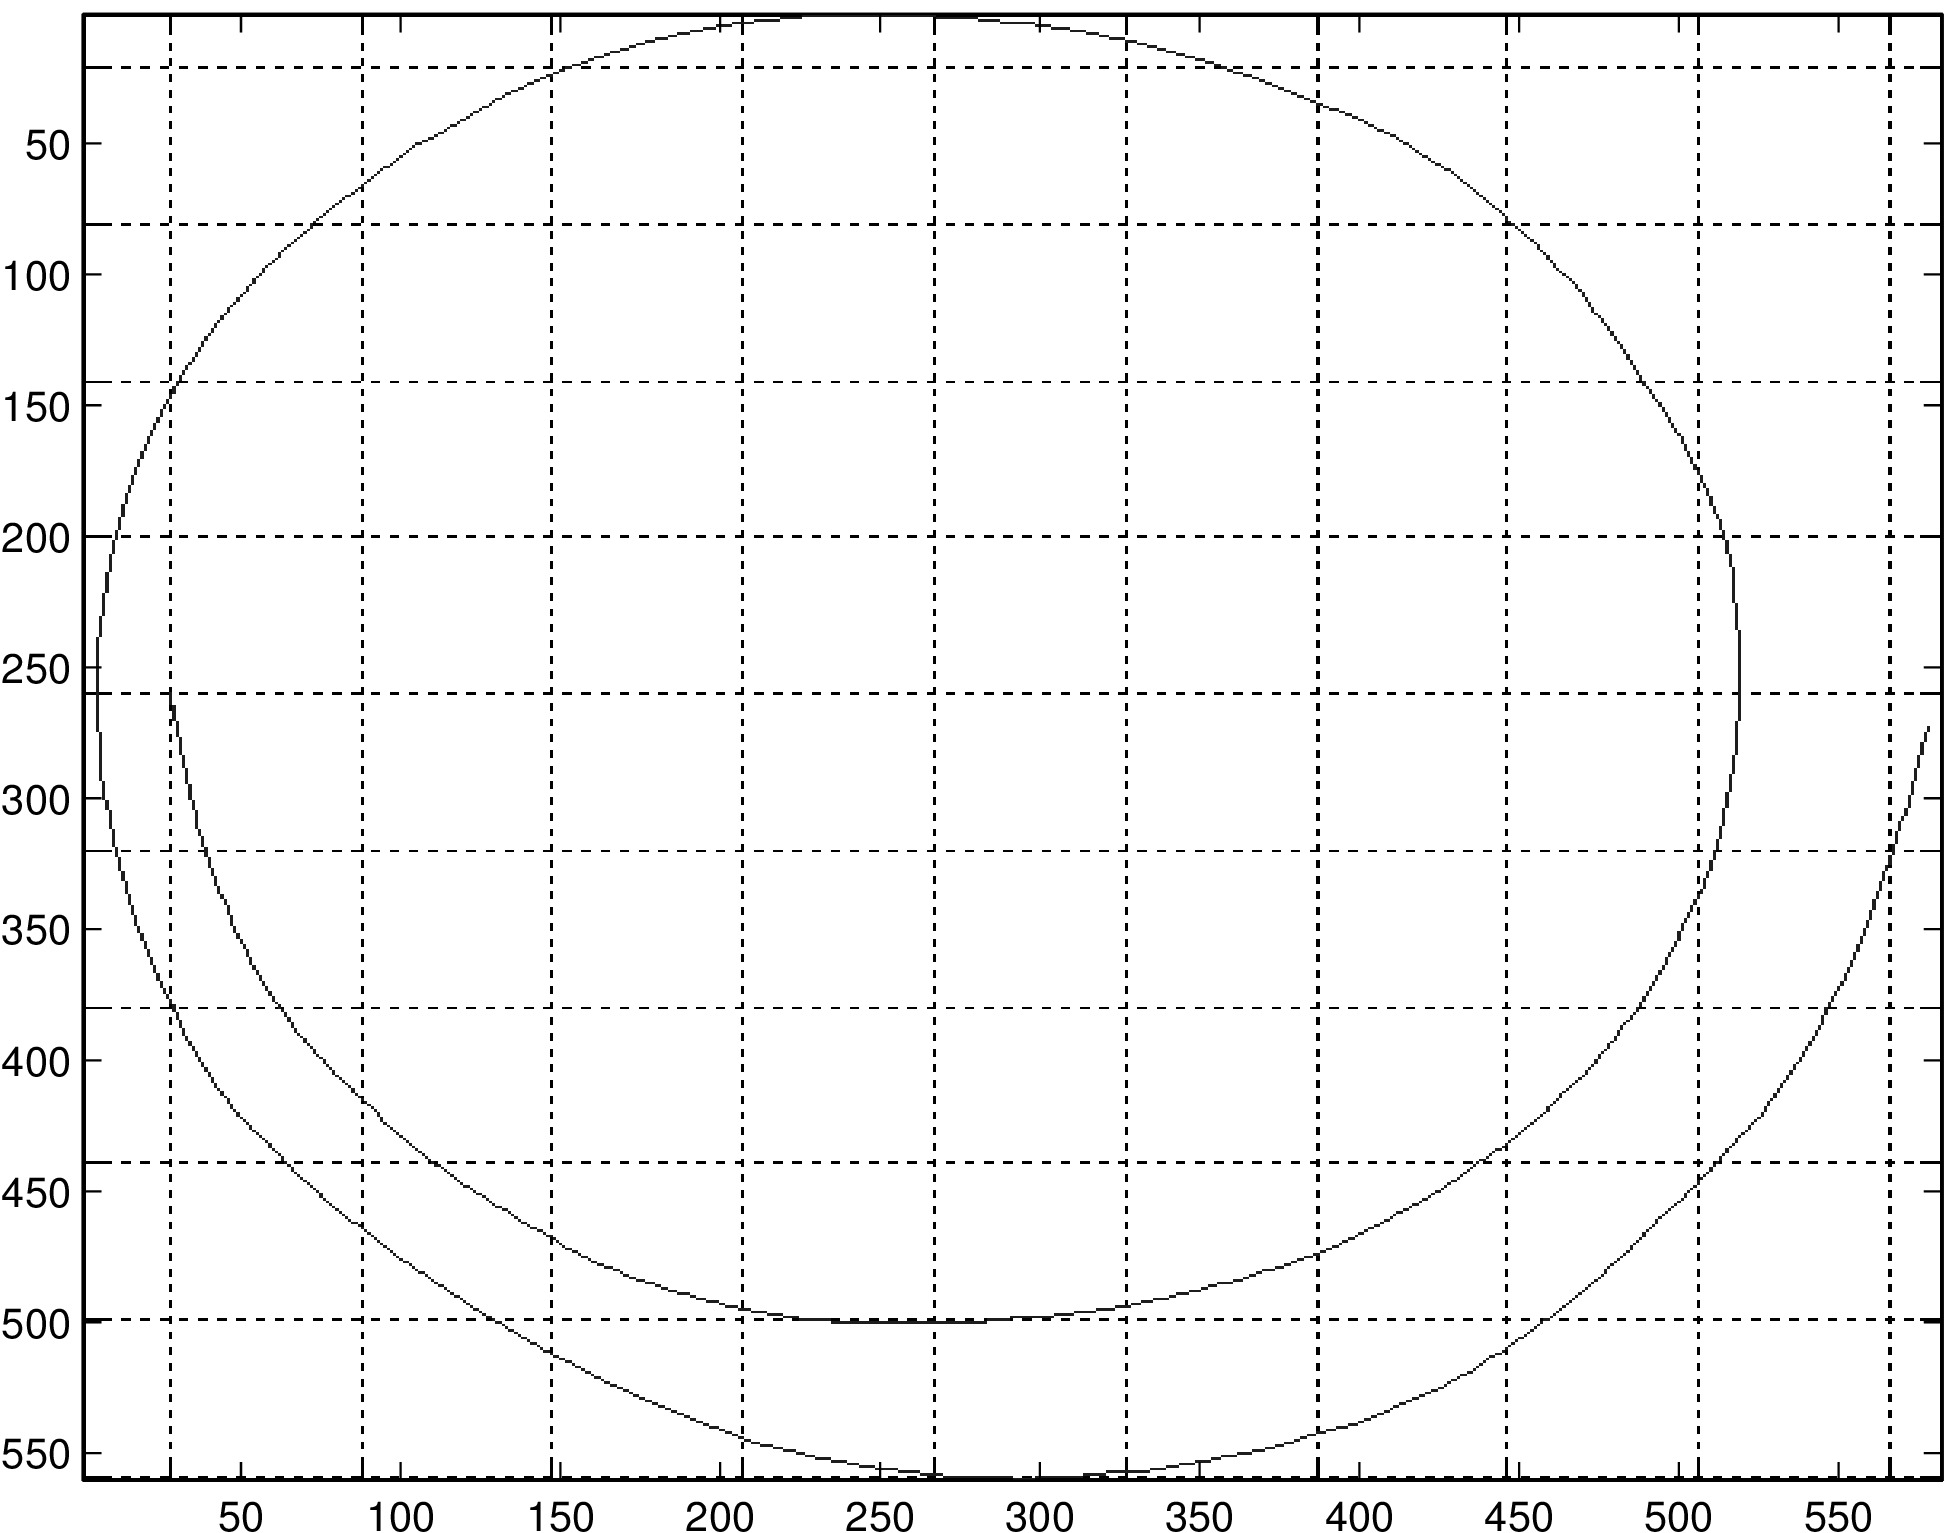
In blue are true x inputs from sensors 3, 4, 5, 6, and 7 for a circle without rotation (the other sensors gave unusable data due to being mismounted on the plasma cutter used to draw circles). In red are inputs for the same path, obtained from its parameterization. Comparisons of observed with ideal input data suggest that negative error is more likely and of a greater average magnitude. These comparisons were done for only a few trials, however, so more comparisons between real and ideal data should be done in order to obtain estimates of expected error that might be included in the tracking algorithm as a correction.
Path Reconstructions
Below are examples of paths reconstructed using our program. In the core algorithm, at each time step the change in the puck's position is computed separately using each pair of sensors, and then averaged over to produce the "true" change in position. There are also options to include the calibration and/or consistency check when reconstructing the path.
Here we reconstructed the path of the same diagonal line with and without the consistency check. In this trial, three of the puck's sensors were held over the edge of the table in order to produce inaccurate readings. While our consistency check is successful in discarding sensors with extreme error, as in this case, it is in general unhelpful in improving reconstructions when error is more moderate.
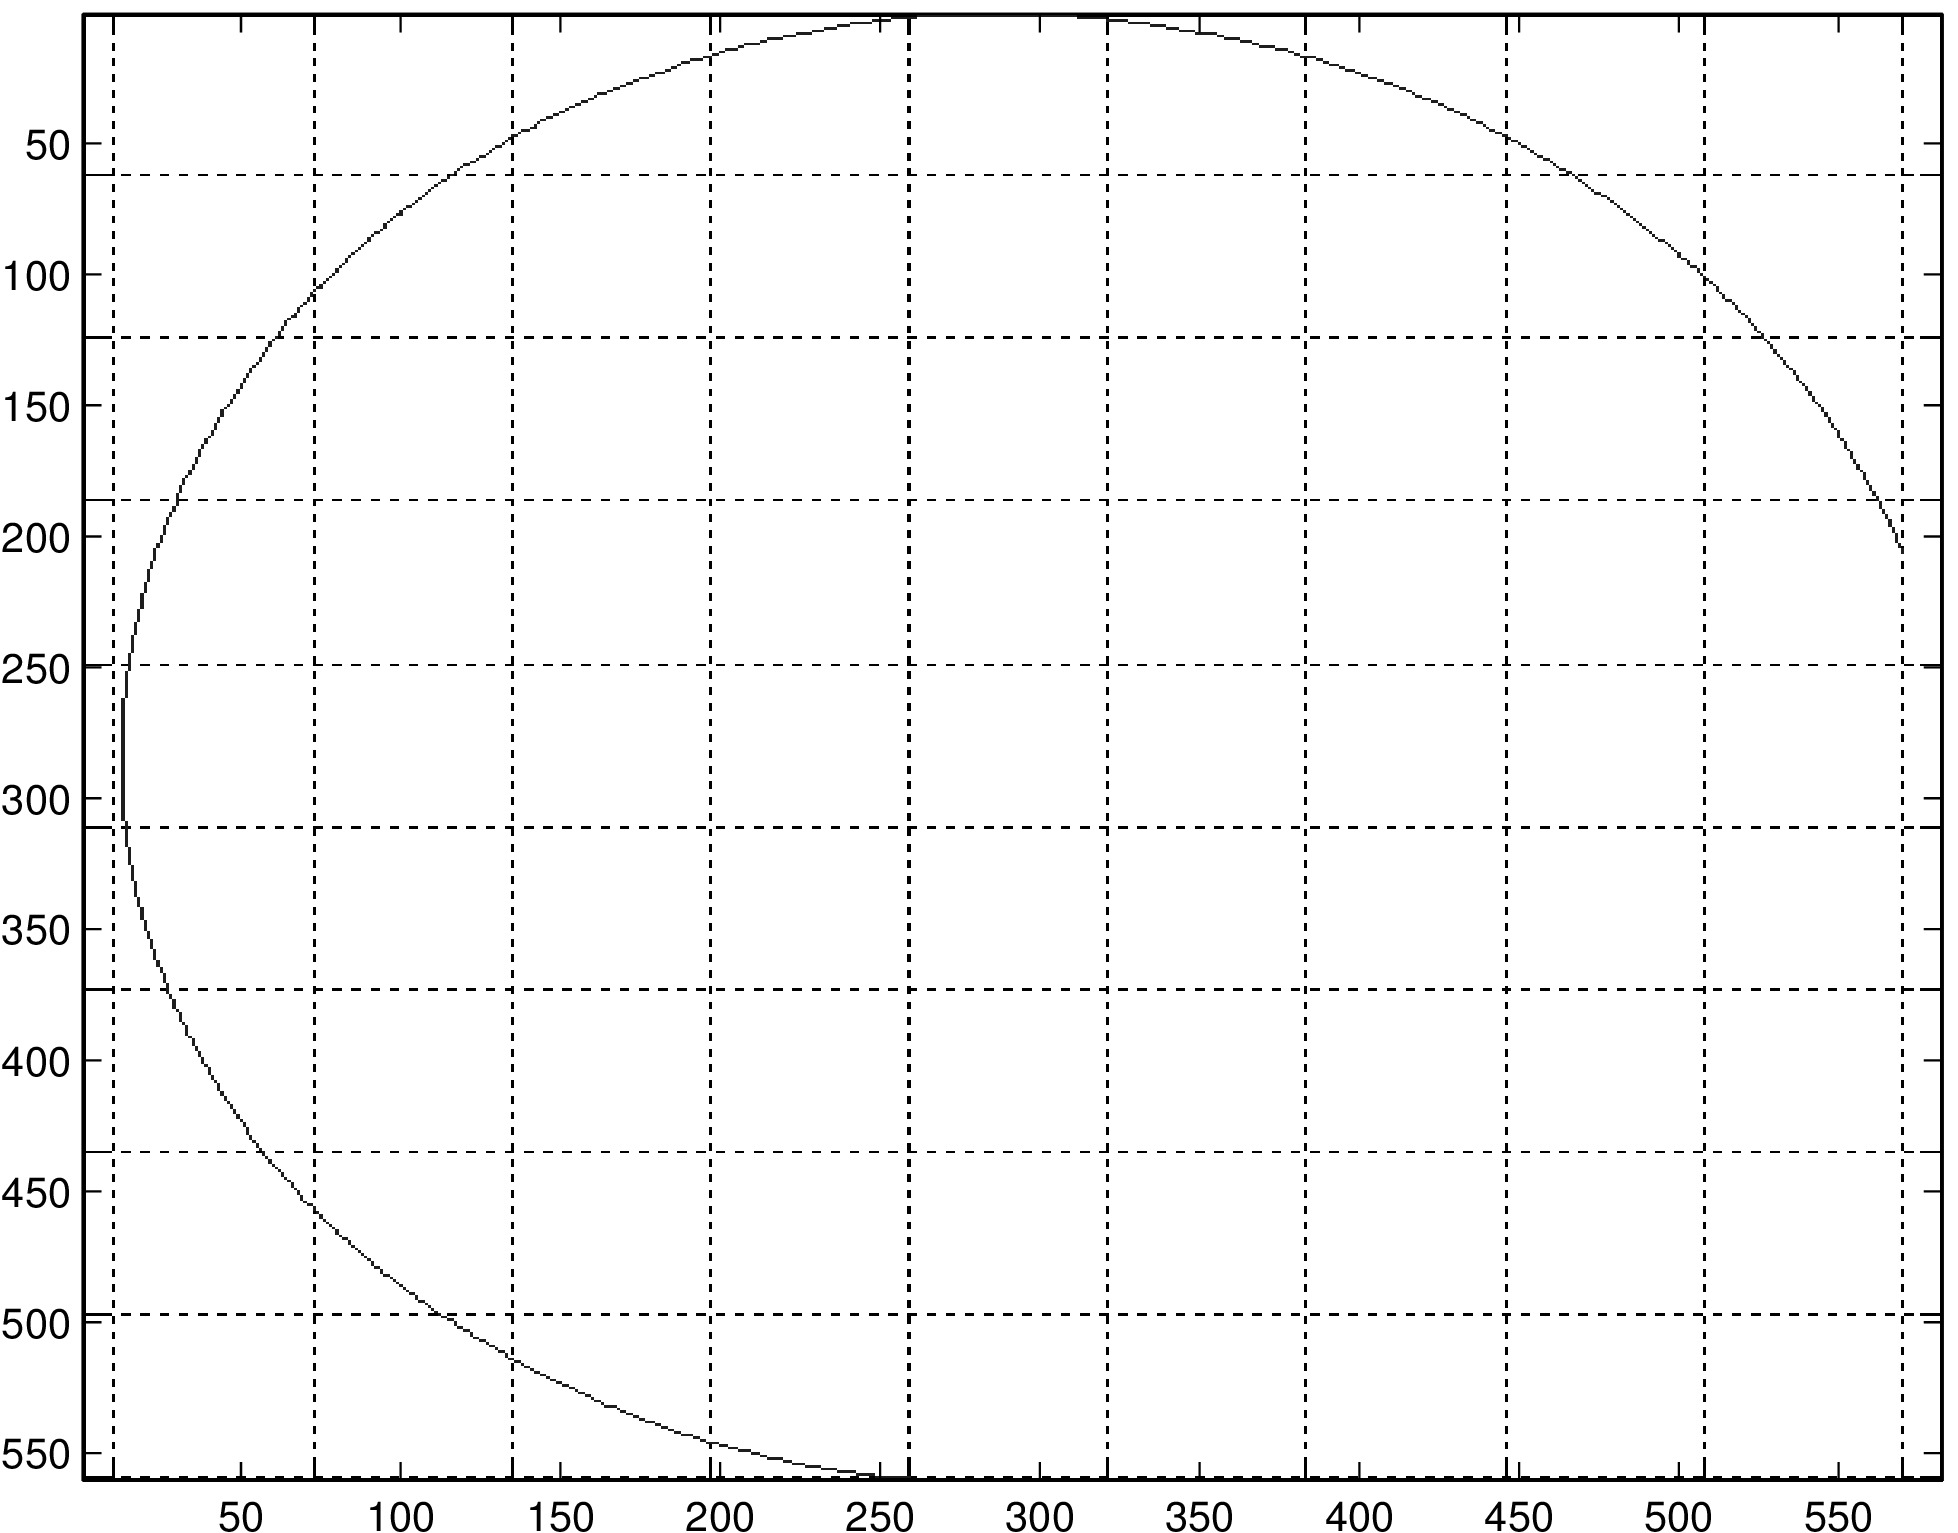
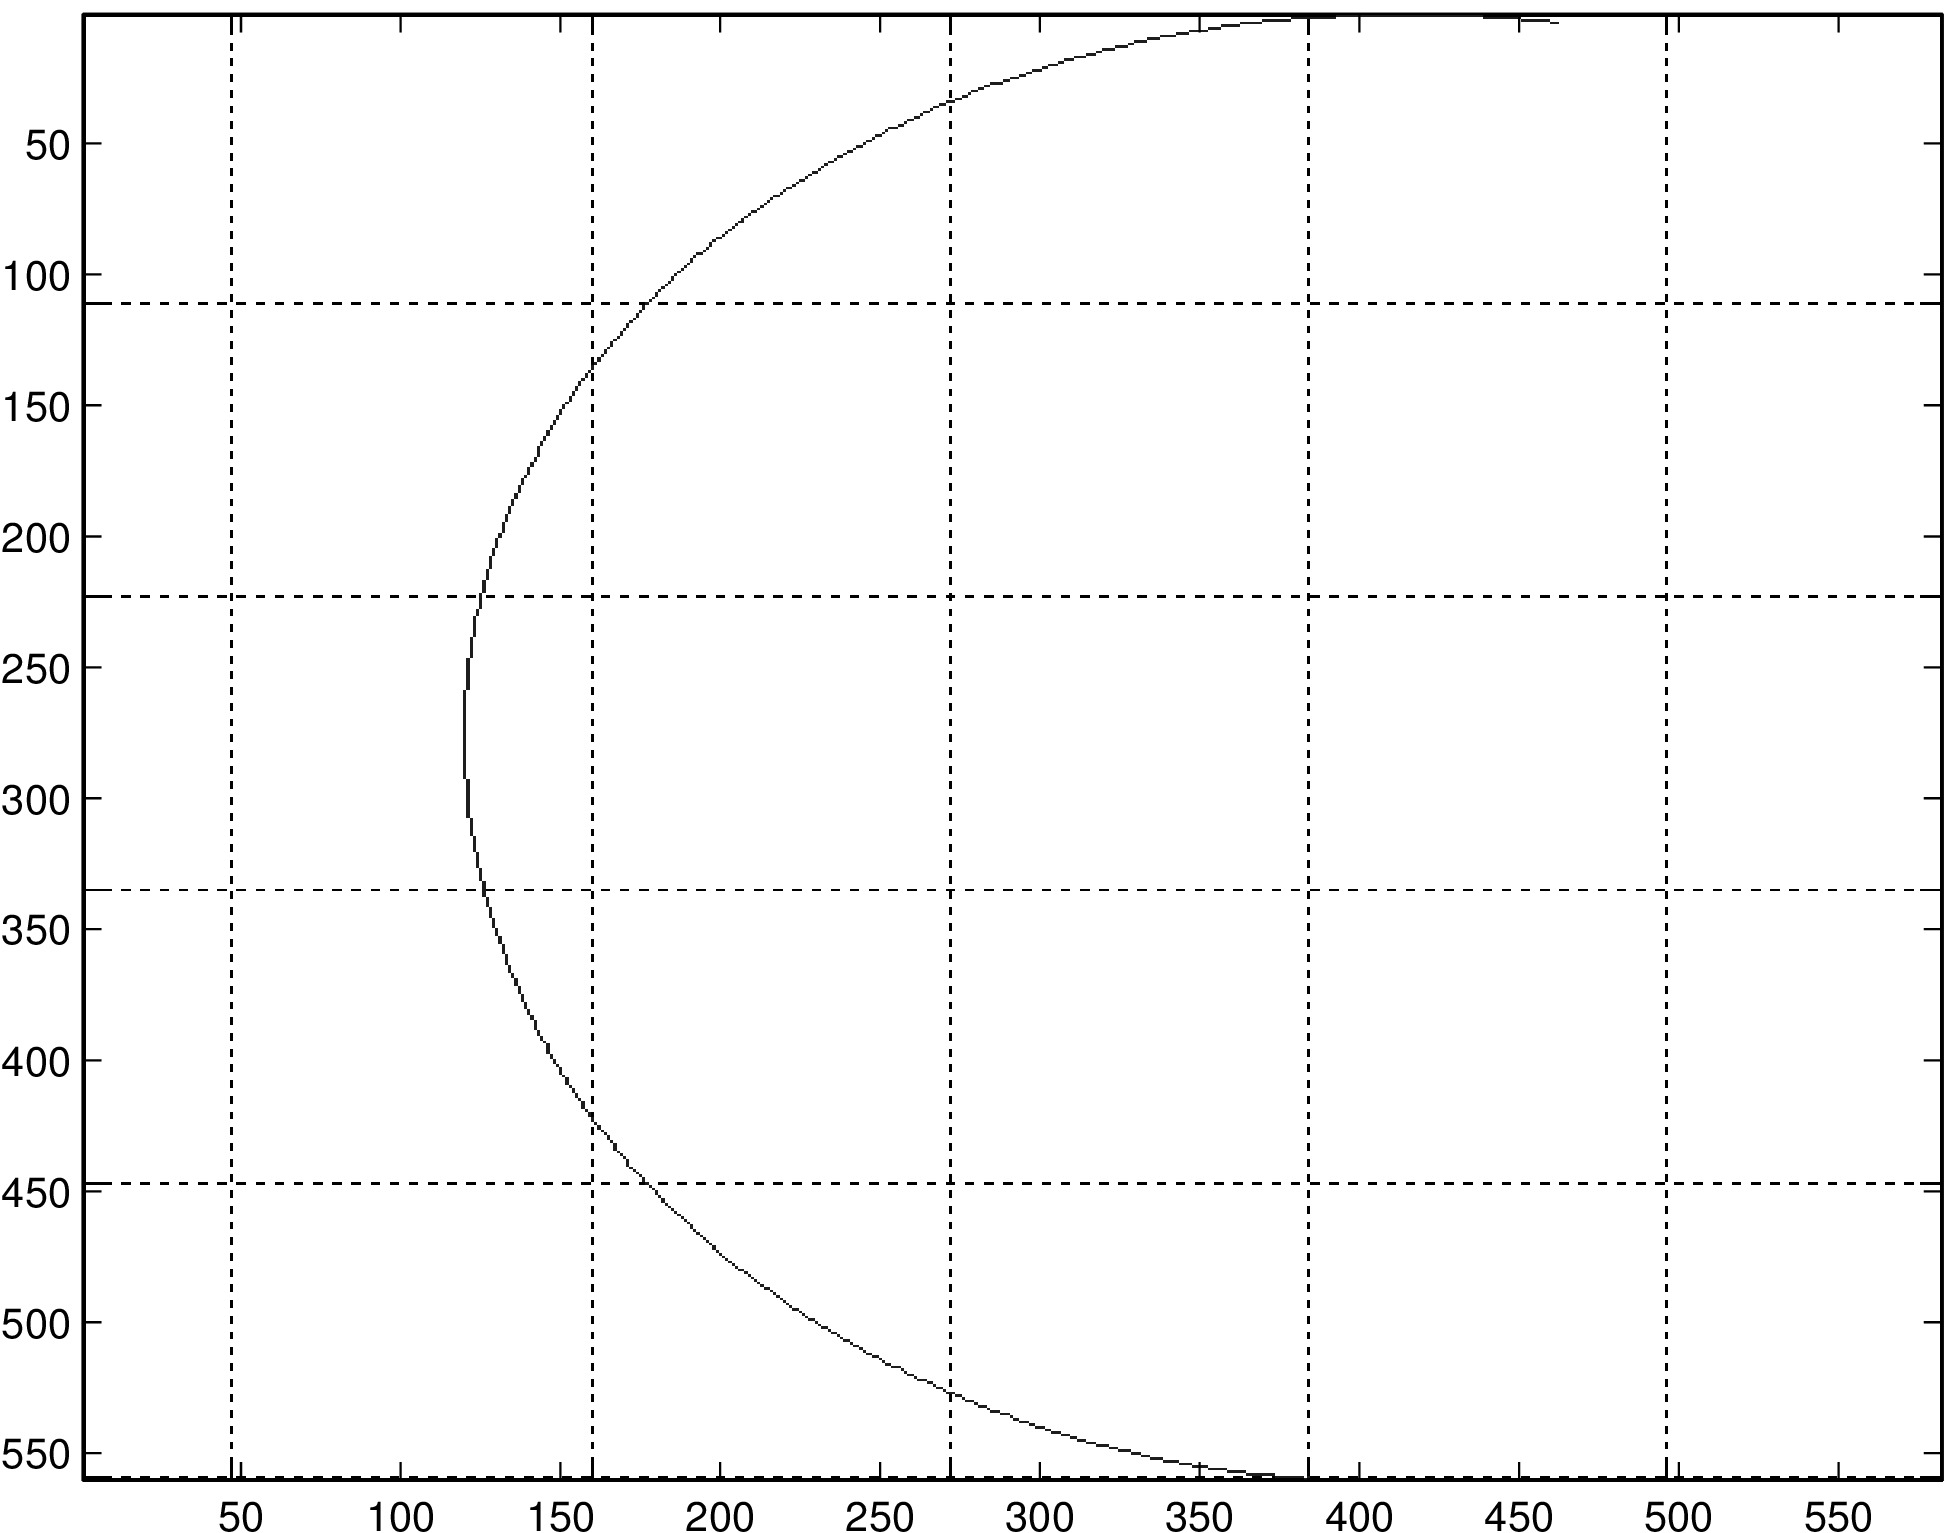
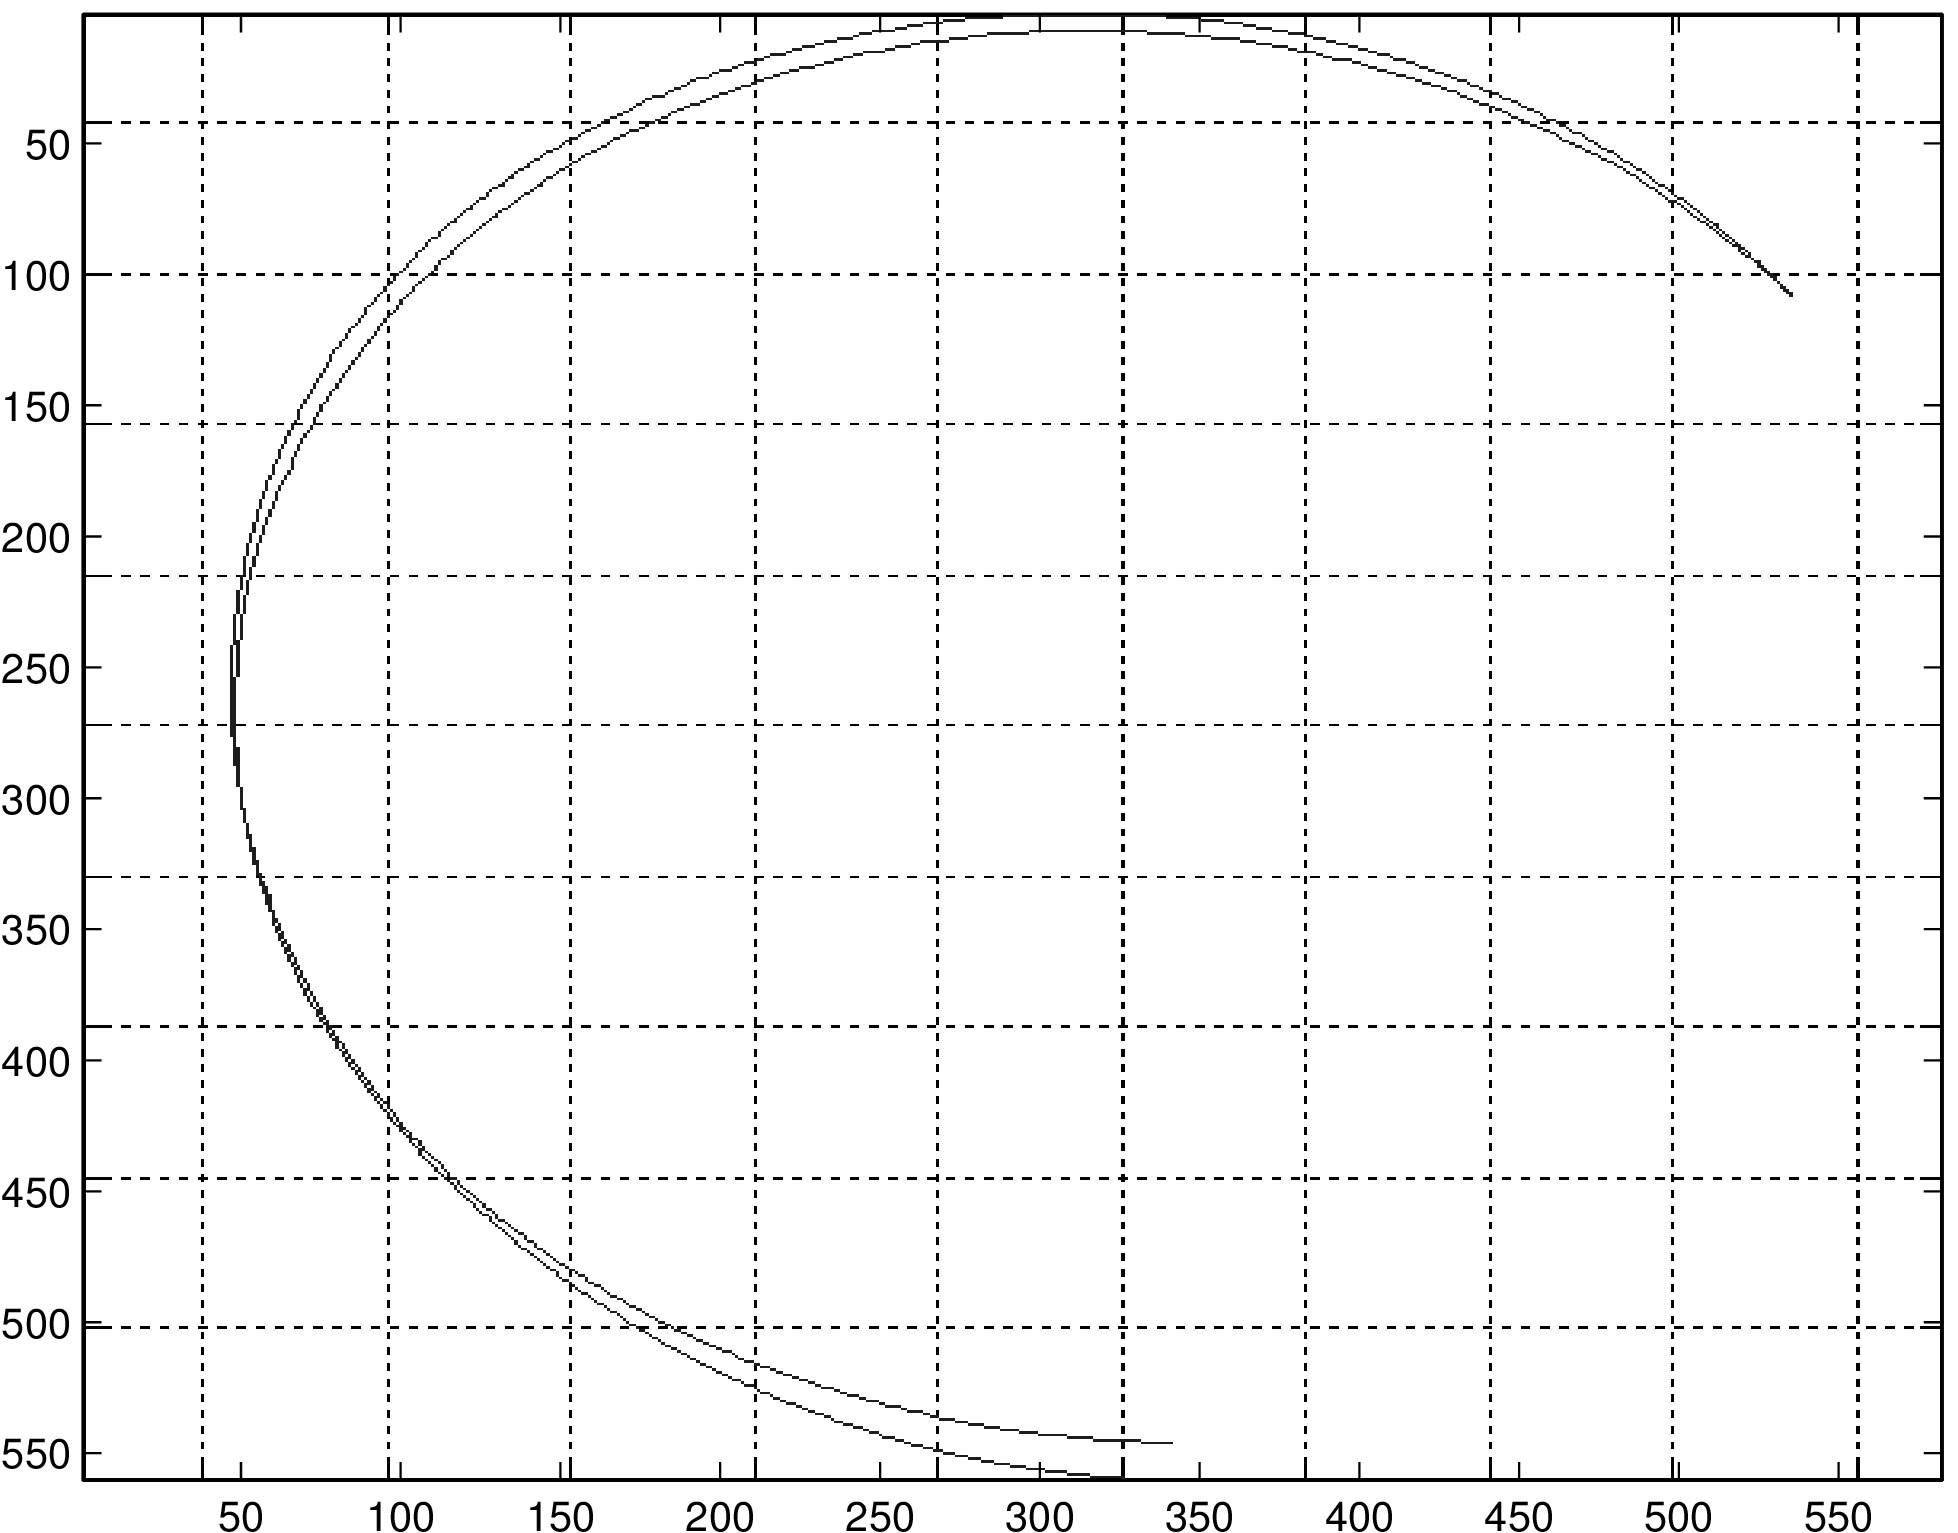
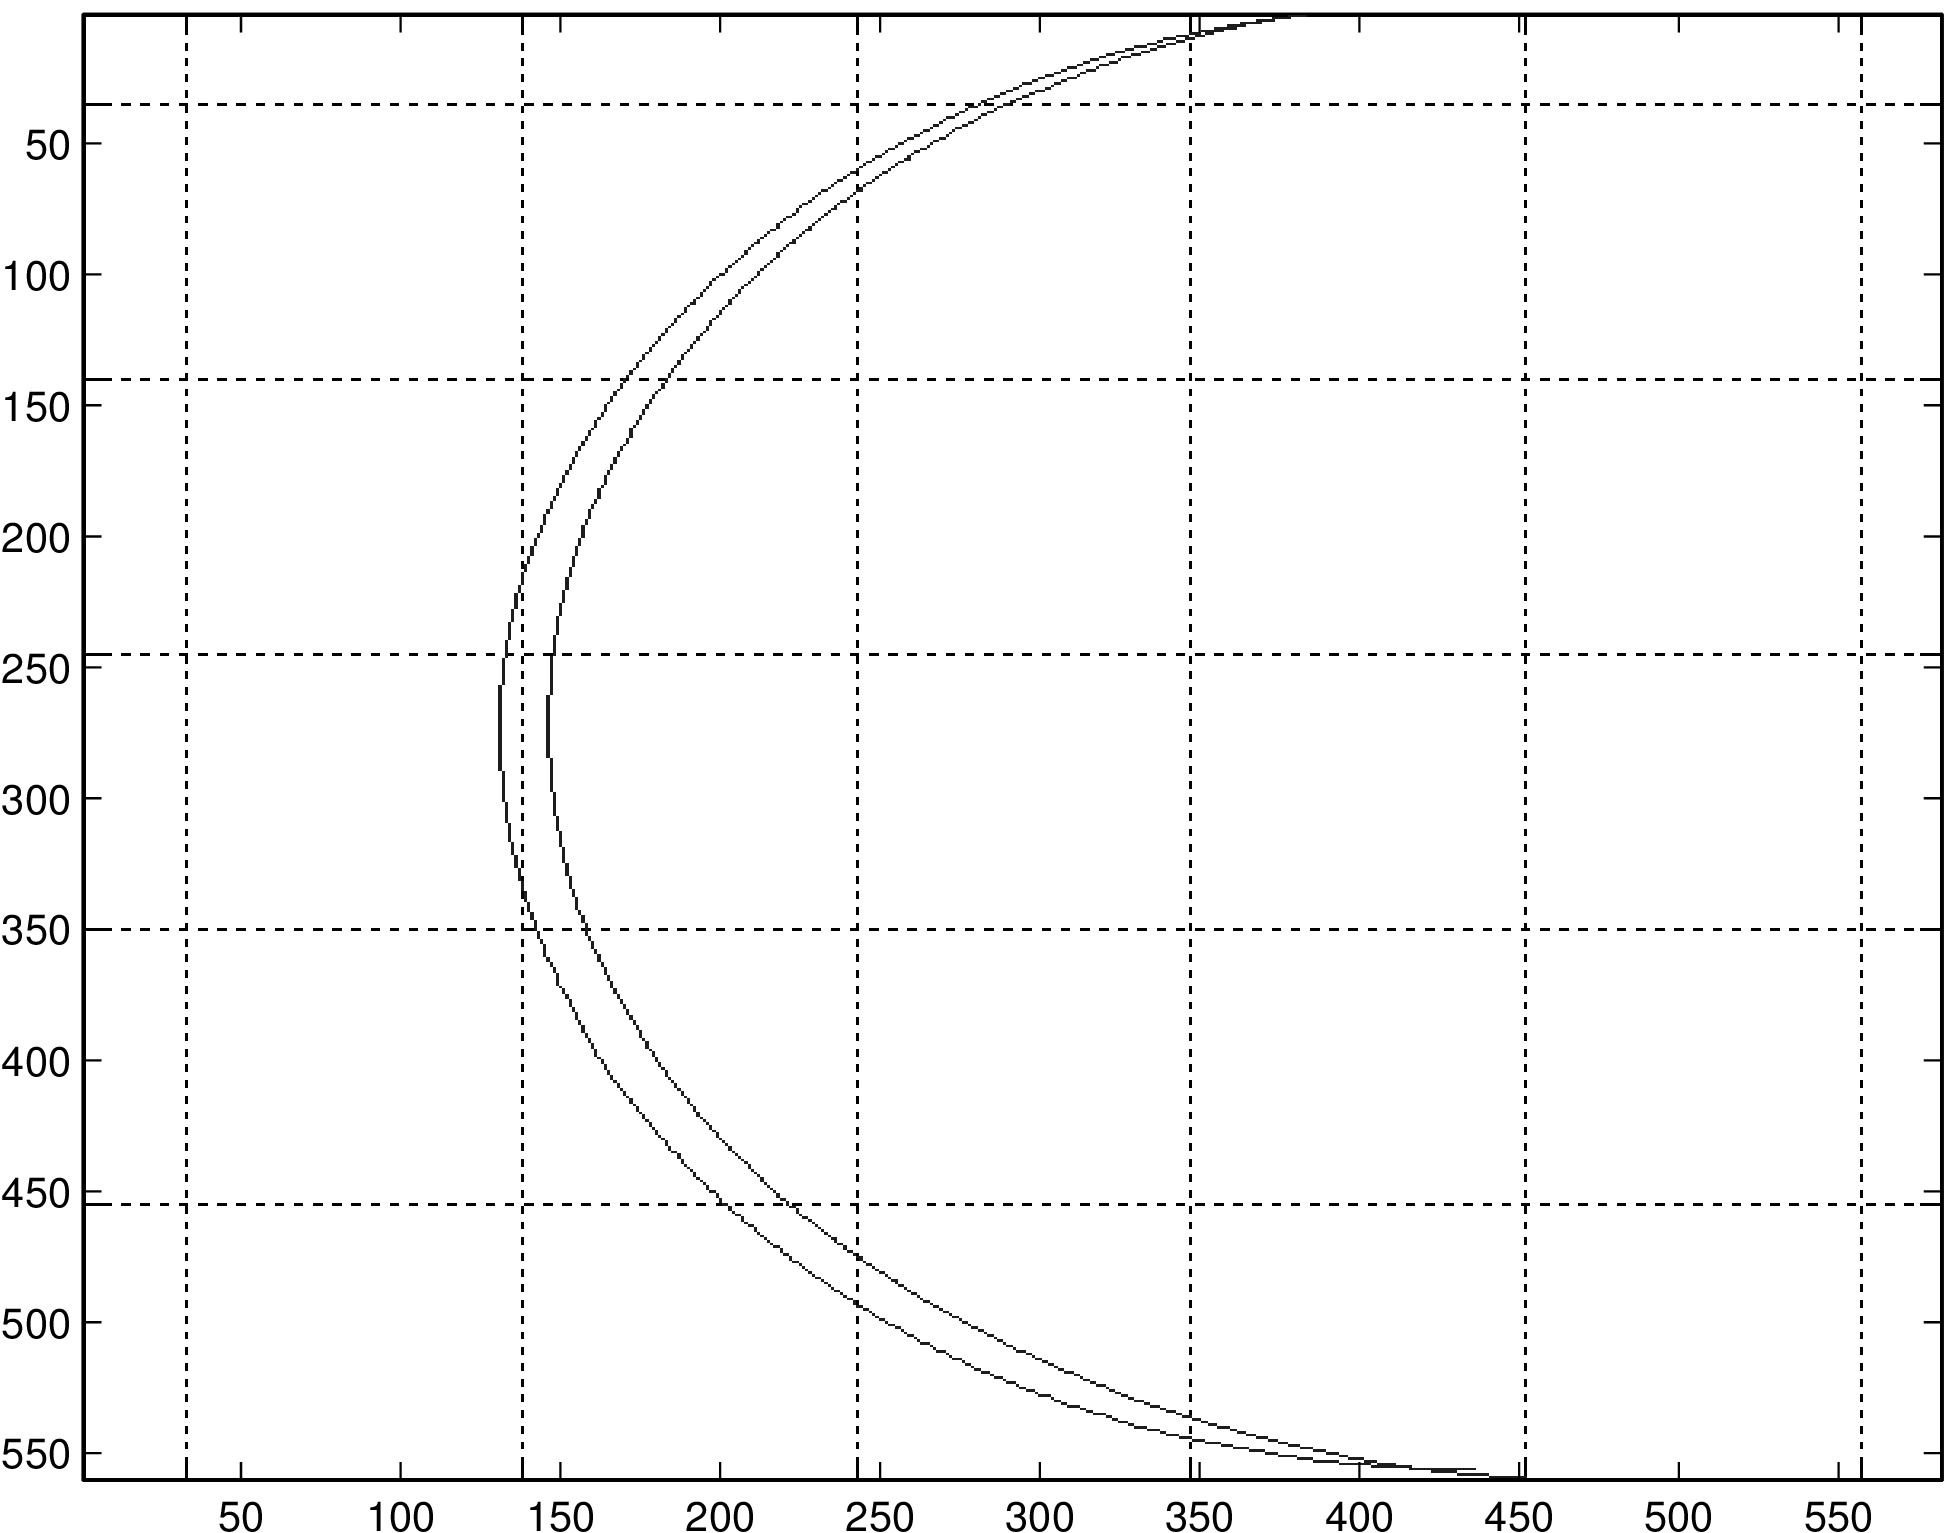
Calibrating the puck generally improves path reconstruction in those trials that we have tried. In the left column, we have reconstructions of a diagonal line, single arc, and double arc (same path traversed once in each direction). On the right are the same paths reconstructed with calibration. Note that in row 3, the two traversals of the half-circle should be overlaid, while in the plot produced by the algorithm they are slightly offset. We believe this to be due to the error that occurs when the puck is moving at low speeds (in this case, when the puck changed direction at the end of the first traversal of the half-circle).
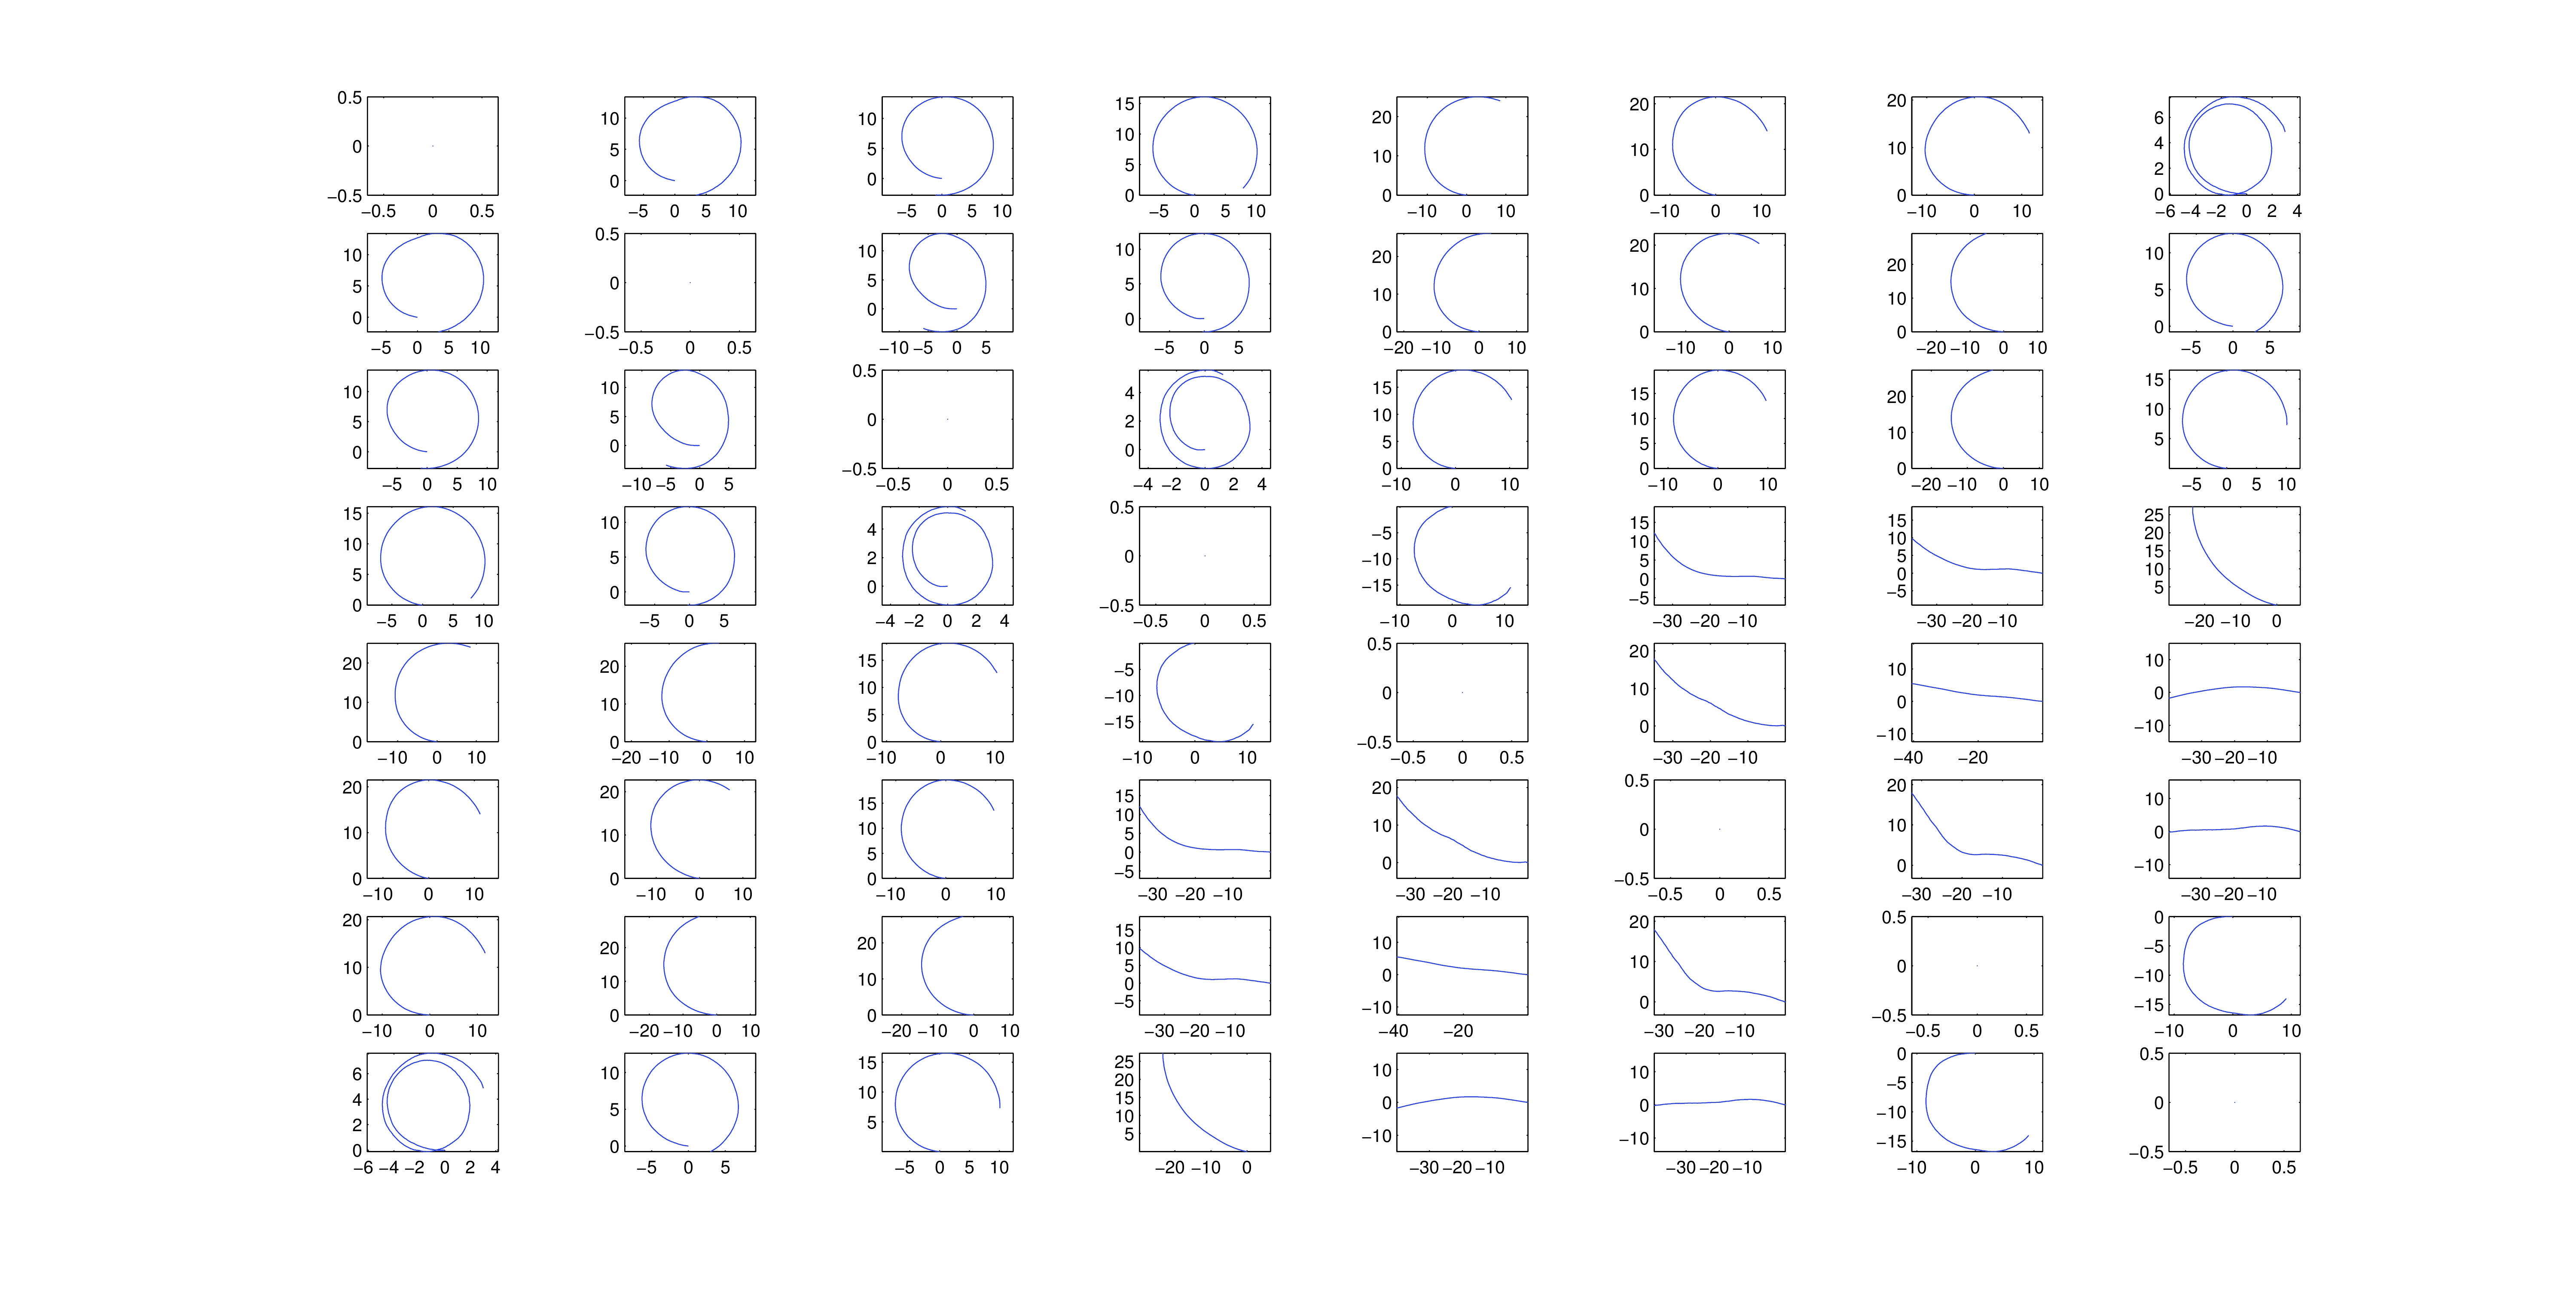
Pairwise Plots
A major remaining issue is the discrepancy between the path reconstruction obtained by averaging the reconstructions of each pair of sensors, and the reconstructions of the individual sensors. Averaging all sensor pairs, while not yet perfectly accurate, generally yields smooth paths that resemble the true path. Examining the pairwise plots (Figure 7), where the ijth plot is the path of the puck's center computed using only sensors i and j, it is unclear how the accurate path of Figure 6 was reconstructed by averaging the pairwise results. Note that the above figure was drawn without the consistency check, so the apparently unreliable sensors evident in the pairwise plots were not discarded - in fact, when these sensors were discarded (not presented here), the reconstructed path became less accurate. Understanding why some pairwise path reconstructions are so inaccurate, and how the average of all sensors can be so accurate despite unreliable pairwise reconstructions may gave insight into the behavior of the algorithm and the puck.